Virtual networks are not so different
Virtual networks work very much the same as physical networks. In many cases, only the names of network devices have changed. For example:- A network interface card (NIC) is now a "virtual NIC" (vNIC).
- A switch is now a "virtual switch" (vSwitch). vSwitches work very similarly to physical switches but don't have the config ability commonly found in traditional switches (such as showing the MAC addresses).
- Multiple vSwitches can be created on each host, and ports on a vSwitch are usually broken down into port groups for specific purposes, such as production or management.
- VLANs are fully supported, and a switch port can be either an access port or a trunk port, just like the in world of physical switches.
- Physical hosts that house the virtual switches are connected to the physical network with real physical server NICs and cables, which are called "uplinks" in a virtual infrastructure.
- Features like promiscuous mode, NIC teaming and load balancing all exist in a virtual environment.
- Spanning-tree protocol is not needed.
- Network traffic cannot flow from one switch to another on the same host.
- Port groups exist in the virtual network but not in the physical network (they may be similar to Cisco SmartPort).
- You can't see the virtual switches or physical cables connecting to the vNICS (and there are no more flashing lights to look at in the wiring closet for most of the servers).
Virtual network traffic analysis using SNMP and NetFlow
Just as in the physical network infrastructure, to analyze network traffic in the virtual world you'll use SNMP or NetFlow to collect data across multiple points of the infrastructure and then analyze it with a network performance management and monitoring tool. Examples of more general network performance monitoring tools include What's Up Gold and Solarwinds Orion. More specific NetFlow collectors and analyzers include Plixer Scrutinizer and Solarwinds NetFlow Traffic Analyzer.Of course you can still do a generic Internet Control Message Protocol (ICMP) monitoring with an element manager like HP OpenView, but it's preferable to do that in addition to some level of utilization and error checking.
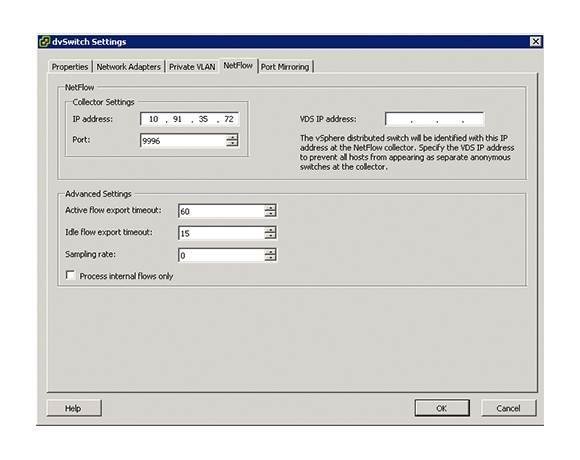
Prior to vSphere5, utilizing NetFlow to monitor the virtual infrastructure was not an option. However, once you implement vSphere 5 (assuming you have the edition with the vSphere Distributed Switch) you can enable NetFlow v5 at the port-group level on an individual dvPort or on an uplink.
By doing so, you'll be able to monitor the following:
- IntRA-host virtual machine traffic (virtual machine-to-virtual machine traffic on the same host)
- IntER-host virtual machine traffic (virtual machine-to-virtual machine traffic on different hosts)
- Virtual machine-to-physical infrastructure traffic
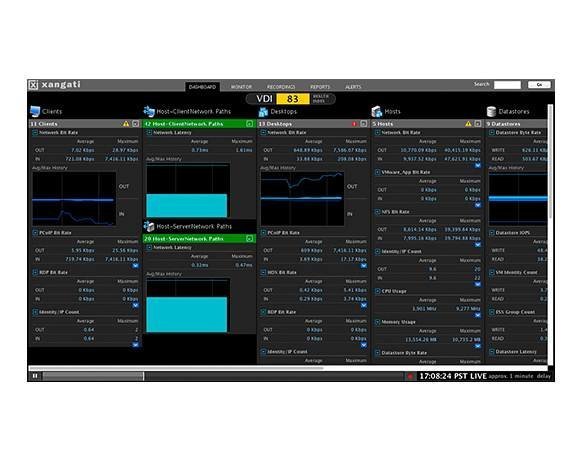
One of the best vSphere network performance monitoring and troubleshooting tools is Xangati for vSphere (which is free) and the Xangati management dashboard. Both versions use NetFlow to collect data about the virtual infrastructure but combine it with other traditional performance metrics from vCenter to provide a very powerful performance monitoring and troubleshooting tool for vSphere infrastructures. The free version monitors a single host, while the management dashboard allows you to monitor many hosts and virtual networks from a single interface.
Note that if you are using Hyper-V instead of vSphere, Microsoft has announced that in Windows Server 2012 Hyper-V, the extensible virtual switch will support the addition of the open source Hyper-V sFlow agent that could then be monitored by sFlow collectors, such as the InMon sFlowTrend Tool.
Virtual network traffic analysis with packet decode
What if you want to do a packet decode from the virtual network? In order to do Deep Packet Inspection (DPI) on a physical network, you would connect your protocol analyzer (which would be running on a laptop, for example) to a switch port and then configure SPAN (or RSPAN if the traffic is on a different switch) to mirror traffic from a single switch port, multiple ports or an entire VLAN.More on networking for virtualization
Using vSphere networking tools to gain control of virtual environmentsvSphere vSwitch design concerns
The storage and network hypervisor are the new virtualization
Prior to vSphere 5, to use a protocol analyzer on the virtual infrastructure you took a VM running a protocol analyzer, created a new port group, configured it for promiscuous mode (so that all packets are sent to all ports), and then moved the VM that you wanted to analyze to that port group (for security reasons you don't want to enable promiscuous mode on a production port group). For details on that, see my post titled "Using a Network Packet Analyzer on a VMware vSphere Virtual Network" (which you would follow if you are still using vSphere 4.x or if you have vSphere 5 but don't have the distributed virtual switch running).
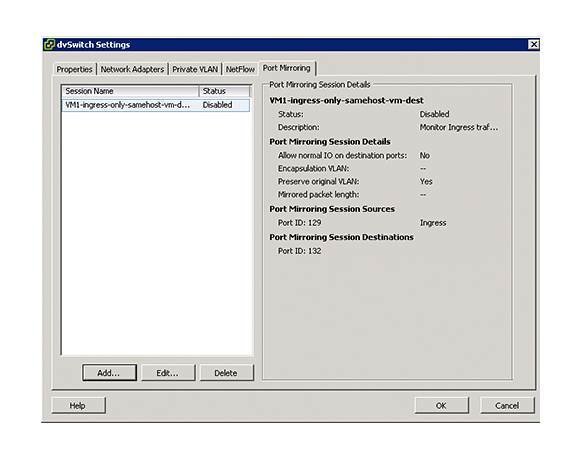
In the vSphere 5 Enterprise Plus, however, the port-mirroring functionality allows you to quickly and easily mirror any dvPort to another port, or you can choose a VLAN to encapsulate these mirrored packets by selecting the "Encapsulations VLAN" box when configuring distributed virtual switch port mirroring.
Once enabled, port mirroring provides visibility into:
- IntRA-host virtual machine traffic (virtual machine-to-virtual machine traffic on the same host)
- IntER-host virtual machine traffic (virtual machine-to-virtual machine traffic on different hosts)
If you are a Hyper-V user, note that in Hyper-V 3 port mirroring is a new feature of the extensible switch.
Analyzing and troubleshooting the network once your servers are virtualized really isn't that different from performing these same tasks with physical servers in the physical network. You have two different paths to get this done depending on the level of detail you need. Using NetFlow is the best choice for high-level traffic analysis and bottleneck identification, where port mirroring with a protocol analyzer is what you would do to perform deep-packet analysis in the virtual infrastructure.
About the Author: David Davis is the author of the best-selling VMware vSphere video training library from Train Signal. He has written hundreds of virtualization articles published on the Web, is a vExpert, VCP, VCAP-DCA, and CCIE #9369, with more than 18 years of enterprise IT experience. His personal Website is VMwareVideos.com.


