Nagios XI is the most powerful IT infrastructure monitoring solution on the market. You can use it to monitor virtually anything. Although Nagios XI is typically meant for more “serious” work, you can have some fun with it as well! I guess I have been somewhat nostalgic lately… Do you remember when a gallon of gas used to cost less than a dollar? 
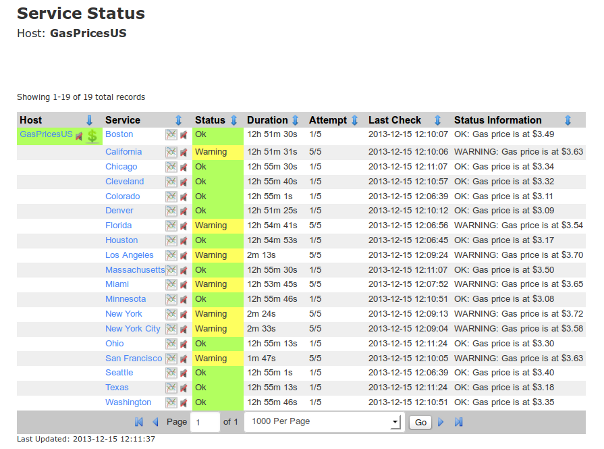
In this article I will show you how to install the check_gas_price.py plugin, set up a dummy host, and add multiple services to it. This will allow you to check the gas prices in the USA. Then you may use the Capacity Planning component in Nagios XI Enterprise Edition to view the trends of gas prices in the USA.
First, download the check_gas_price.py plugin from this URL:
Next, install the plugin from the Nagios XI web interface by going to: Admin --> Manage Plugins --> Choose File,then select the check_gas_price.py file and click Upload Plugin.
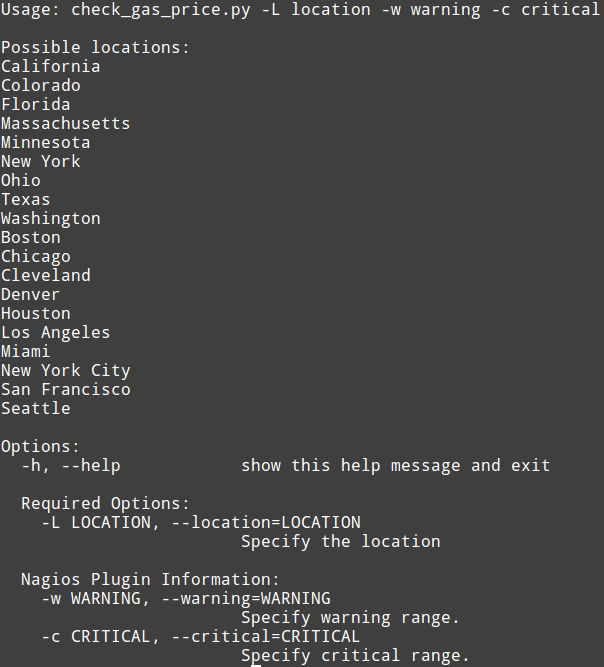
If you would like, you can view the plugins’ usage by typing in terminal:
1
|
/usr/local/nagios/libexec/check_gas_price.py -h
|
Your output should look like this:
Create a new command by going to: Core Config Manager --> Commands –> Add New. I named my command “check_gas_price” but you can use whatever name you like.
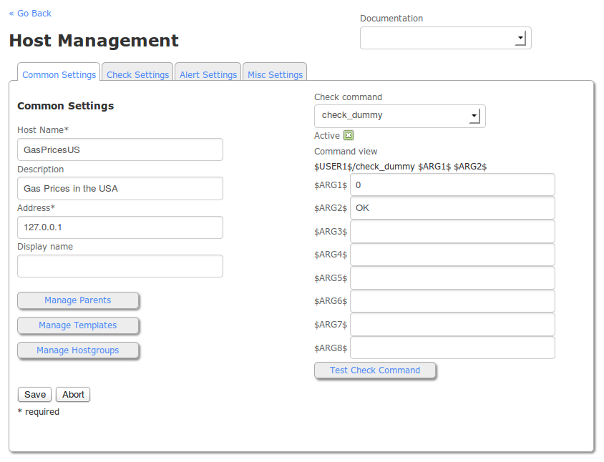
Next, create a dummy host and add some services to it for checking gas prices in the USA by selectingcheck_dummy from the Check Command dropdown.
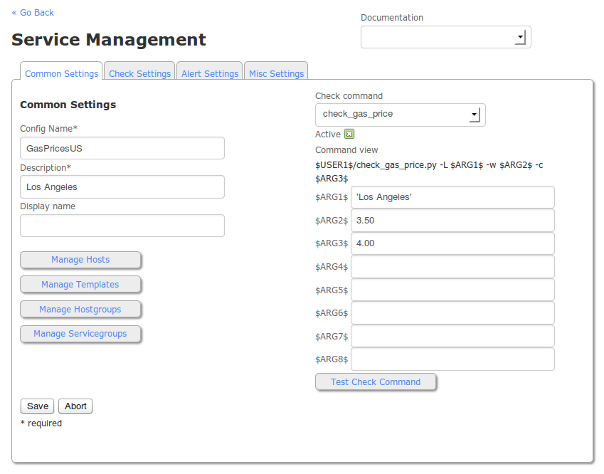
The values necessary to create a successful gas price monitor are as follows:
Config Name = The name of your “host” (Note: in this case it is purely organizational, thus the name GasPricesUS)
Description = The name of the service as displayed by Nagios XI
$ARG1$ = Location (Note: This is limited to the list of cities and states found in the -h Help call for the plugin)
$ARG2$ = At what price would you like to receive a Warning notification?
$ARG3$ = At what price would you like to receive a Critical notification?
Note: Don’t forget to wrap the location in $ARG1$ in single quotes in case there is a space in the name. If you don’t use single quotes, you will get syntax errors.
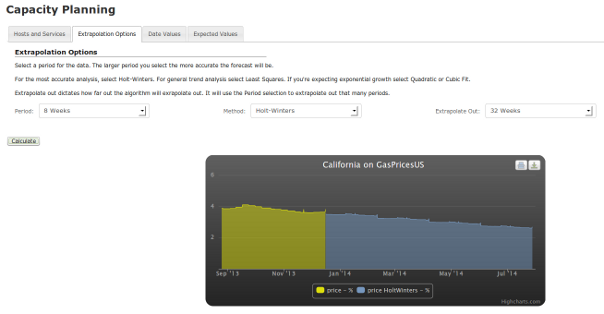
After monitoring gas prices for a good length of time, you can take the historical data that has gathered and use the Capacity Planning component to observe trends and forecast future gas prices.
Here I used an 8 week period and extrapolated out 32 weeks. I don’t believe the gas prices in California will ever reach $1/gallon (at least not any time soon), but I sure do like the trend that is shown on the graph. 
If you want to learn more about the Capacity Planning component, view the documentation at the following link:
If you want to see what other cool features are present in Nagios XI Enterprise Edition, please visit the URL below:
Happy monitoring!

