Enterprise software vendors often offer free versions of their tools, typically geared toward smaller organizations with limited budgets. ManageEngine OpManager is a monitoring tool that's available in free and paid versions. OpManager Free Edition, which can be licensed to manage up to 10 devices, provides useful information about servers and other monitoring devices. Here's a look at how it works:
After downloading OpManager Free Edition online and installing it on your machine, inform the Setup wizard that you want the Free Edition. Otherwise, it defaults to a 30-day trial version. Next, choose the devices you want to monitor. To do this, enter an IP address (or an IP address range) and a set of credentials.
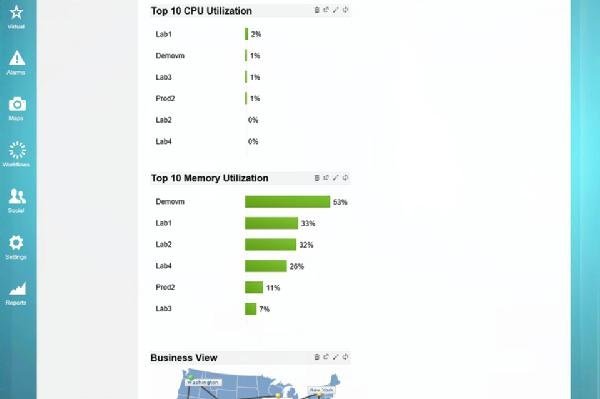
OpManager uses authentication credentials -- ones not requiring agents -- to connect to monitored devices. The software supports the use of SNMP (versions 1, 2, and 3), Windows/WMI, Telnet/SSH, and VMware. Figure 1 shows a breakdown of CPU and memory use across monitored devices.
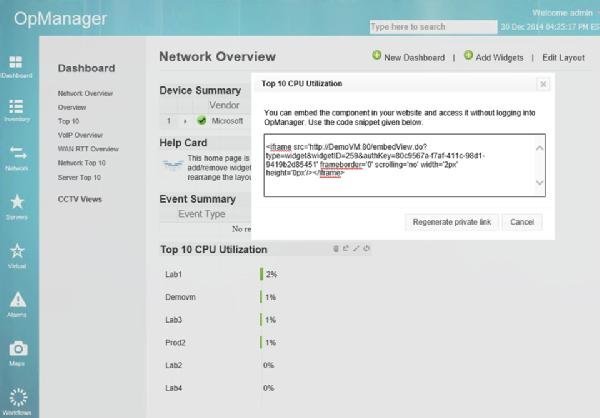
One useful thing about the monitoring data OpManager provides is that ManageEngine provides the tools needed to make the data available from outside the OpManager console. In Figure 2, OpManager provides a block of HTML code that corresponds to the top 10 CPU utilization data. You can embed this code into a SharePoint site or any other website to access monitoring data outside of the OpManager console.
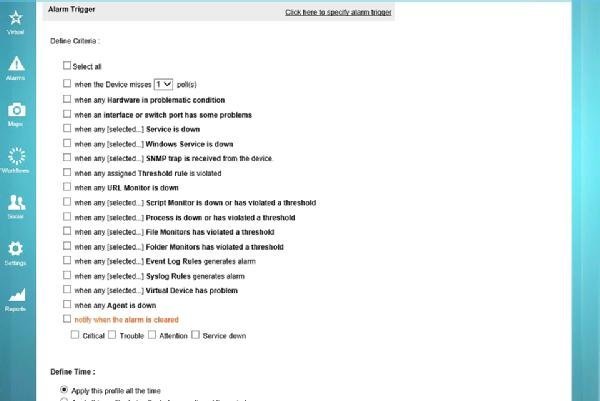
In addition to statistics, OpManager also has a robust workflow engine. Admins can manually run workflows, or they can set them to respond to an alarm or run on a specific schedule. For example, a workflow might launch when a process stops or has violated a threshold requirement. Figure 3 shows some of the available triggers.
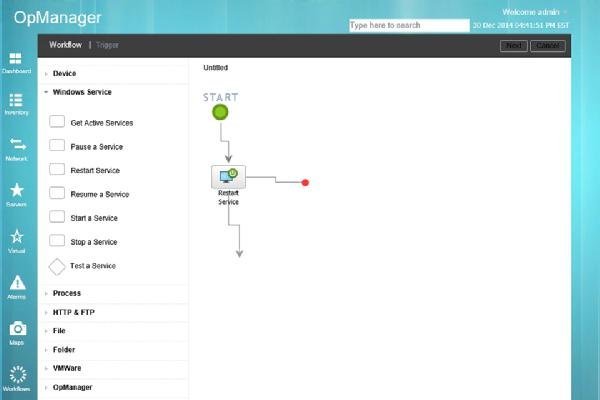
Workflows are easy to build and are flexible. OpManager uses a Visio-style interface that lets an administrator drag and drop various actions and conditions to a workspace. Actions are divided into categories. For example, there are actions related to devices, Windows services, processes, HTTP and FTP, files, folders, VMware, and OpManager. Figure 4 shows the workflow construction process.
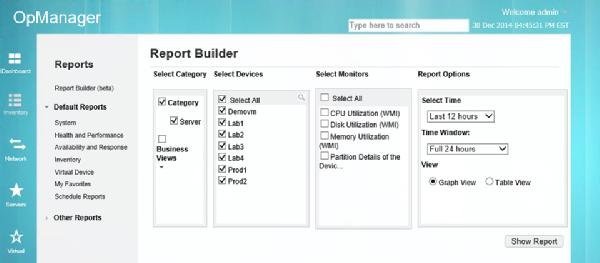
Many of the built-in reports display the same types of information you can view through various dashboards, but the software allows you build your own reports. The reporting engine is shown in Figure 5.
This was first published in January 2015

