Building dynamic database charts with PHPRunner
Charts provide quick and easy way to visualize even the most complex data. PHPRunner allows you to build database-based charts (Line, pie, doughnut, horizontal/vertical bars, 3D and others).
With PHPRunner you can create, customize, preview and deploy any chart with just a few mouse clicks. Right in the PHPRunner's Visual Editor environment you can copy and paste any chart to any other page (i.e. report/list/view/another chart) which will allow you to quickly build powerful dashboards with multiple graphs on the same page.
Charts require the data fields that store numeric values. However, you can build a chart based on any data if you are using aggregate functions.
Consider the following Orders table:
| Customer | Country | Total |
|---|---|---|
| Andrew Peters | USA | $250 |
| Katie Bradshow | Australia | $85 |
| Jeff Simpson | USA | $150 |
| Arnold Matteus | Germany | $120 |
| Arnold Matteus | Germany | $160 |
| Jeff Montgomery | GB | $150 |
| Andrew Peters | USA | $65 |
| Jeff Simpson | USA | $95 |
| Luke Sohu | France | $40 |
| Jeff Montgomery | GB | $120 |
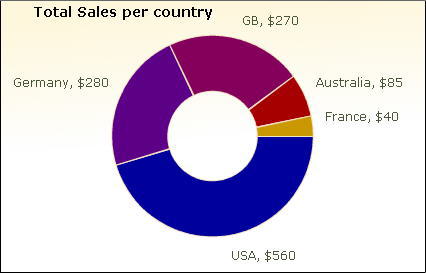
Example 1: Total Sales per country
1
2
3
4
| select Country, sum(total) as STotalfrom Ordersgroup by countryorder by 2 desc |
This query produces the following results:
| Country | Stotal |
|---|---|
| USA | $560 |
| Germany | $280 |
| GB | $270 |
| Australia | $85 |
| France | $40 |
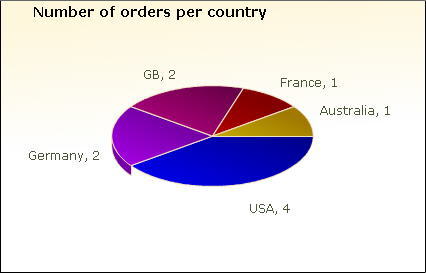
Example 2: Number of orders per country
1
2
3
4
| select Country, count(total) as CTotalfrom Ordersgroup by countryorder by 2 desc |
This query produces the following results:
| Country | Ctotal |
|---|---|
| USA | 4 |
| Germany | 2 |
| GB | 2 |
| Australia | 1 |
| France | 1 |