Comprehensive IT Operations Management Software for Data Centers and Large Enterprises
Most companies today rely on their IT for delivering business services to their end users. Any delay or disruption in the service delivery will affect the business very badly. IT teams strive hard to keep the MTTR to the lowest so that they can achieve their SLAs. However, it is easier said than done because IT involves various layers such as network, server and storage, and application. Without knowing where the fault is it is impossible to fix it quickly.
To spot the problem area quickly, a fair amount of knowledge into each of the IT layers is necessary. Only in-depth monitoring of these layers can provide such insights. On the other hand all these information should be able to correlate with other layers so that a root cause of the problem can be found without wasting much time.
Single console for entire IT operations management
OpManager with its plug-ins offers visibility into network, server and storage, and application layers with correlation between the fault and performance data of these layers from a single web console.
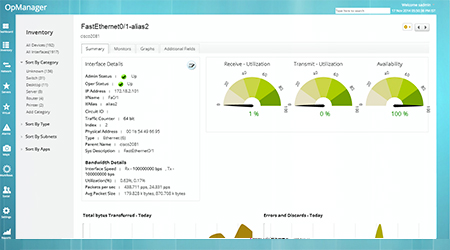
Network Monitoring
OpManager monitors network devices such as routers, switches, firewalls, load balances, wireless access points, etc. via SNMP and CLI protocols. It monitors performance metrics such as CPU, memory, interface traffic, errors and discards, packet loss, response time, etc.
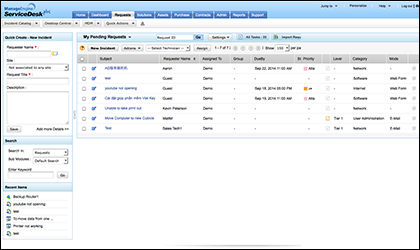
Integrated ITIL-ready ServiceDesk
OpManager tightly integrates with ManageEngine ServiceDesk Plus (SDP) to give you an efficient IT fault management system to automate creation and assigning of trouble-tickets. You can now check out the knowledgebase in SDP for known solutions, investigate further on network and device performance through OpManager, check asset 'audit trails' in SDP and do a lot more using the powerful combination.
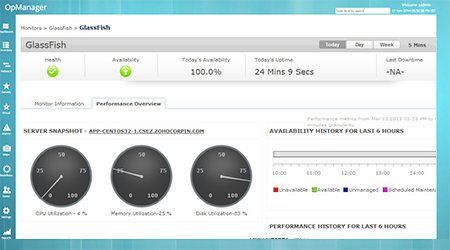
Application Performance Management
Monitor 50+ mission critical applications such as Oracle, SAP, Websphere, Microsoft.Net and databases such as Cassandra, Sysbase, out of the box with Application Monitoring plug-in (powered by ManageEngine Applications Manager). You can monitor metrics such as response time, resource availability, and much more.
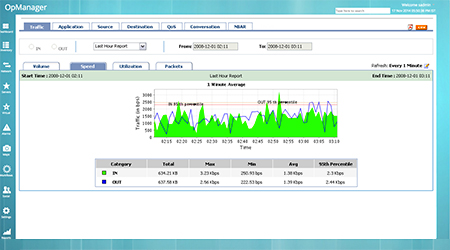
Network Traffic Analysis
Network Traffic Analysis plug-in (powered by ManageEngie Network Traffic Analyzer) controls LAN and WAN traffic by analyzing the flows exported by routers and switches. It supports a wide variety of flows such as NetFlow, sFlow, jFlow, IPFIX, etc. It provides information on devices, applications, and users that consume more bandwidth and streamline bandwidth by setting appropriate QoS policies.
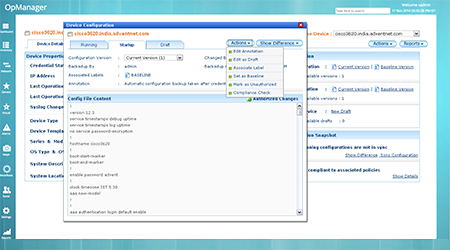
Network Configuration Management
Network configuration changes are critical and needs to monitored 24x7. NCM plug-in (powered by ManageEngine DeviceExpert) not only monitors network configurations for changes but also takes periodical backups of configuration changes. It also allows you to push configuration changes from its web GUI itself, via an approval board.
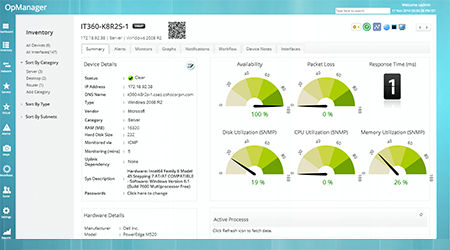
Server Performance Monitoring
OpManager monitors physical servers such as Windows, Linux, Unix, and Solaris servers and virtual servers such as VMware, Hyper-V, and Xen servers. It monitors various performance metrics, which include, CPU, Memory, and Disk and processes, services, events, and much more.
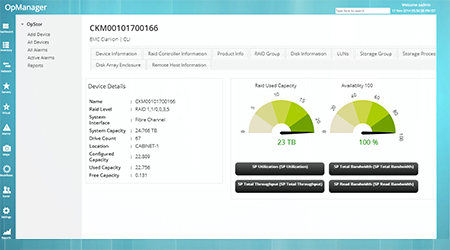
Storage Devices Monitoring
Storage plug-in (powered by ManageEngine OpStor) monitors more than 100 types of storage devices ranging from storage arrays, fabric switches, tape libraries, tape drives, and Hot Bus Adaptor cards. It helps you monitor performance metrics such as IOPS, Reads and Writes, and Cache configuration.
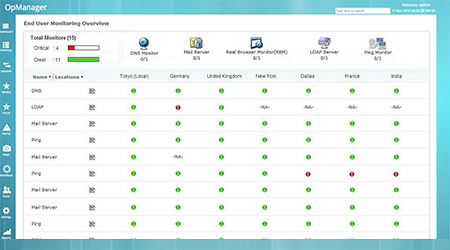
End-user Experience Monitoring
Application Monitoring plug-in (powered by ManageEngine Applications Manager) also helps you monitor end-user experience of business critical networks such as DNS, LDAP, Ping and Mail server from enterprise branch offices or actual customer locations. This helps you know whether the fault is at the data center or at the other end.
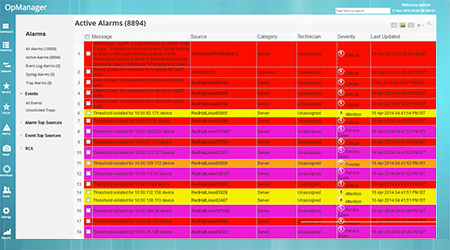
Intelligent Fault Monitoring
OpManager offer multi-level threshold for proactive monitoring which helps you find faults at it various stages and act accordingly. OpManager notifies faults immediately via email and SMS and also includes Workflow Automation to remediate such faults automatically.
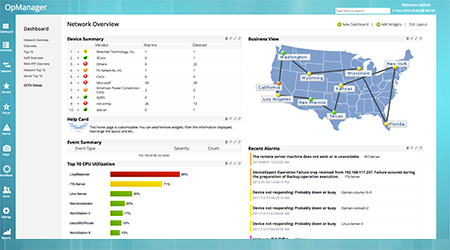
Intuitive Dashboard and Widgets
OpManager offers dashboards and widgets, which helps you view the performance of your IT at-a-glance. You can create widgets and customize dashboards to your needs and the get the required information displayed. You can display these dashboards on NOC screens and monitor your IT operations 24x7.