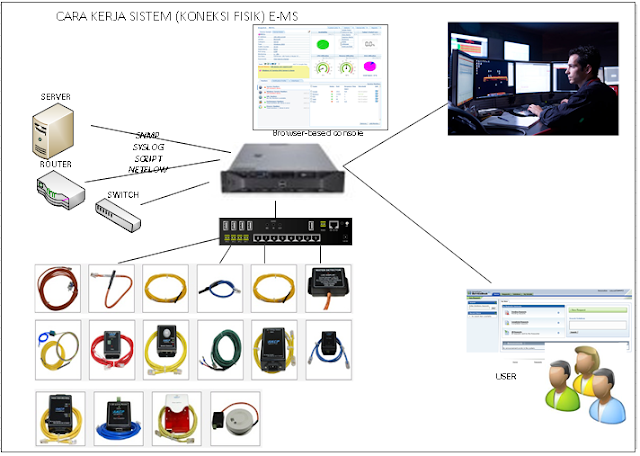
Monitoring datacenter performance - a synergy of server performance (both physical & virtual), application performance, and sufficient bandwidth, is a great challenge. The challenge rises multifold when disparate monitoring tools are used.
Whenever an end user reports slow access to an application, the issue could be with the server or bandwidth or application itself. To find out the exact issue you have to poke your head into multiple monitors and look out every nook and corner, right from server performance to bandwidth bottlenecks to application performance. You will not find any correlation between the data provided by the tools. By the time you organize the data and hunt down the issue, the application would have gone down completely.
Monitor your Datacenter Performance from OpManager's unified web console
ManageEngine OpManager offers an integrated approach towards datacenter monitoring that helps you proactively monitor physical & virtual servers, applications and bandwidth to the core; yet manage their faults from a single console. OpManager offers a single alarm console where all the issues irrespective of the type whether it is an application, server or bandwidth, are raised. This makes it easy for the technicians to pick up the alarms in real-time, drill down to the exact issue and start troubleshooting it before the end user feels the impact.
OpManager offers:
- In-depth physical and virtual server performance monitoring
- Real-time application monitoring by integrating Applications Manager
- Flow-based traffic monitoring with NetFlow plug-in
- Datacenter environment monitoring
Physical and virtual server monitoring
OpManager out-of-the-box includes support for the widely used servers such as Windows, Linux, Solaris, VMware, Hyper-V, and much more. It offers dedicated dashboards for the worst performing Hosts and VMs that need immediate attention. More.
In-depth Application Monitoring
OpManager monitors the performance of mission critical applications such as Oracle, JBoss, Tomcat, WebLogic, WebSphere, SilverStream, GlassFish, and much more by integrating ManageEngine Applications Manager. You can customize the tabs and load Applications Manager's web client in OpManager web client.
Flow-based bandwidth monitoring
OpManager's NetFlow Plug-in leverages flow-based network traffic analysis to show you how exactly your bandwidth is being utilized through interface - specific reports on which user, application, source, destination, conversation, etc. is occupying bandwidth. More.
Datacenter environment monitoring
Temperature is also a very critical parameter in datacenter monitoring. OpManager monitors temperature of servers and routers. You can configure thresholds and monitor them proactively. We integrate with AKCP (www.akcp.com) sensors to gain more powerfull sensors
Contact Us for detail : Office 62-21-29622097/98, HP:08121057533, email: askme@dayaciptamandiri.com


