
For many of us, meetings that used to happen in person are now happening virtually since much of the world has switched to working remotely. Because we are relying so heavily on conducting important business meetings over online meeting platforms, monitoring the availability of those online services is more important than ever.
As far as video conferencing tools go, Zoom is everywhere these days. It's just about ubiquitous, and it’s the hot technology allowing us all to remain connected. And of course, knowing when it is down is crucial, because it means that a company can make a temporary switch to another platform, or at least inform its users that the service is down.
And because we at Paessler were using Zoom long before the recent lock down, it made sense that we would try and figure out how to monitor it with PRTG Network Monitor. Here's the solution we found. And the great news is that the solution is similar for other video conferencing software, too – take a look at our list at the end of this post.
The concept
Like most other companies that provide publicly accessible services on the Internet, Zoom provides both a system status web page, and helpful documentation on the Zoom API. There you can get the status of various services, such as Zoom's live streaming service, the web client, the web portal, Zoom meetings, and so on.
Obviously, we need to retrieve and evaluate the status for each service from this API. The best option to do this is with the versatile REST Custom sensor in PRTG. For some clarity on the REST Custom sensor, here's a description from the PRTG user manual:
The REST Custom sensor queries a Representational State Transfer (REST) application programming interface (API) endpoint and maps the JavaScript Object Notation (JSON) or Extensible Markup Language (XML) result to sensor values.
In other words, you can use the REST Custom sensor to display values retrieved from a REST API. To do this, you need to map the values from the API to the values that are displayed by the sensor in PRTG. This is accomplished by means of a JSON template file (*.template). This is, of course, a very simplified explanation of how it works; for the more technically-minded, you can read more about the sensor here.
We can use the REST Custom sensor to retrieve values from the Zoom API and show them as service names with statuses in PRTG. Now, usually getting it all set up would take a bit of time and effort, but we’ve created everything you need and put together step-by-step instructions so that you can easily get up and running.
How to do it
It makes sense that you need PRTG Network Monitor. We offer a fully-featured 30 day trial, so you can download that to try it out if you don't already have it installed.
Then, you need the template files and a how-to guide. For that, visit our Knowledge Base article called "How can I monitor Zoom with PRTG?". There you get a ZIP file with all the files you need to get it working. Just follow the instructions in the Knowledge Base article, and very soon you will have something that looks similar to this in PRTG:
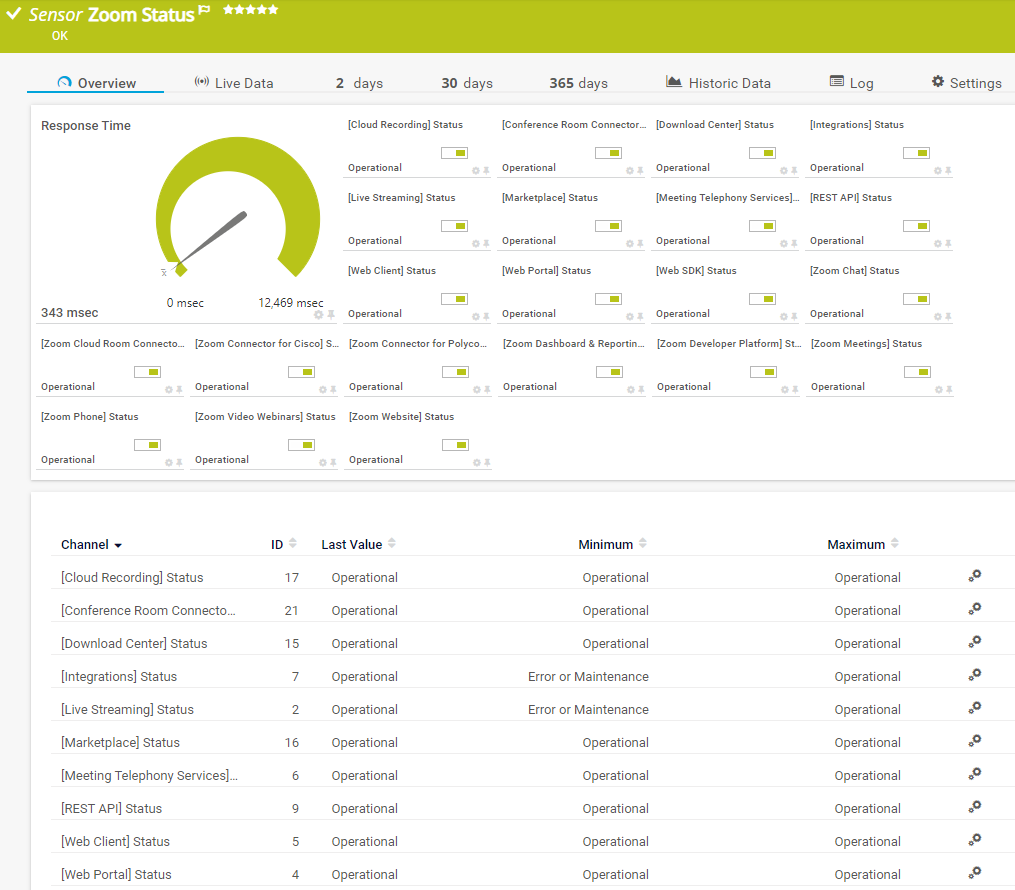
Now you can see at a glance the status of the different Zoom services, and you can configure alerts to notify you if they are down.
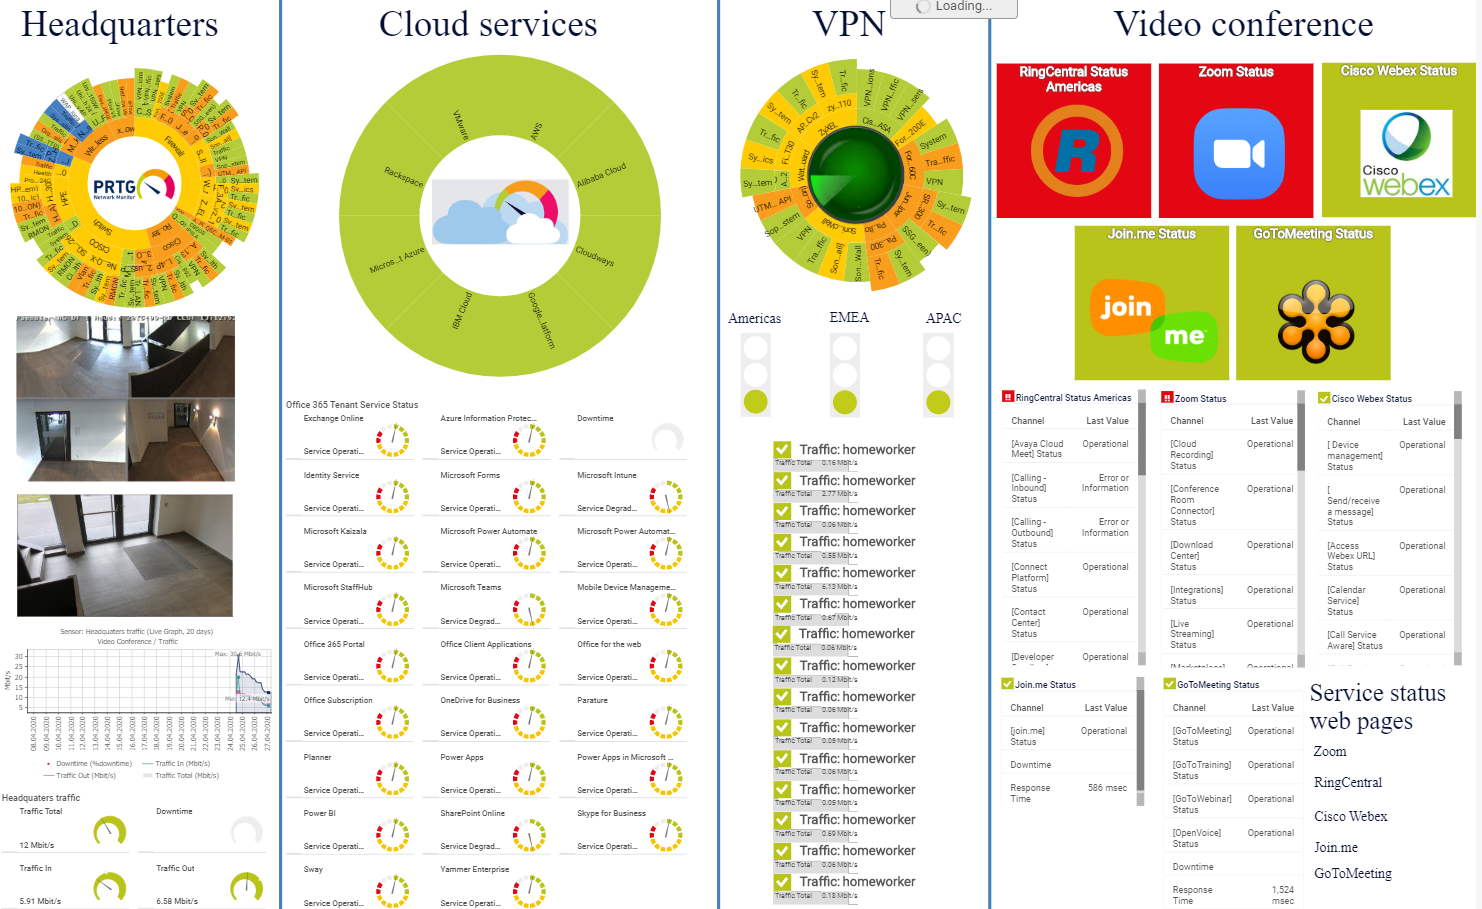
And, if you're monitoring your IT infrastructure from home, here's a sample dashboard to show you how the video conference metrics can be added to your view of everything in one place:
Other videoconferencing platforms
The great news is that this doesn't only work for Zoom! You can use a similar solution to monitor the status of other platforms, too. We also have Knowledge Base articles with instructions and template files for those as well:
- How can I monitor GoToMeeting with PRTG?
- How can I monitor Cisco Webex with PRTG?
- How can I monitor RingCentral with PRTG?
- How can I monitor join.me with PRTG?
What videoconferencing tool do you use? And let us know in the comments if you set up PRTG to monitor it!


