
 Originally published on September 07, 2020 by Simon Bell
Last updated on September 07, 2020 • 14 minute read
PRTG provides a broad overview of the health and performance of networks of all sizes. By combining that breadth of monitoring, with the deep dive traffic analytics of Flowmon, administrators gain insight into what’s happening in their networks.
To find out more about getting insight into your IT with Flowmon and PRTG Network Monitor, sign up for our webinar by clicking this banner (and then read on below):
Introduction
As everyone knows, PRTG is a proven, all-round infrastructure monitoring tool - network performance, server health, storage availability, service state; we’ve got all that covered. We can even monitor your IoT, medical and industrial environments too.
But what if you need to go deeper – What’s causing that sudden spike in network traffic? Why are users complaining about poor application performance? For that you need a more specialised tool, and that’s where Flowmon comes in.
Now, please don’t make the same mistake I did. When I was asked to take a look at Flowmon’s tool set, I thought “OK, it’s JAFT (Just Another Flow Tool) like all the others out there”. I could not have been more wrong. Yes, the system is based around capturing and analysing flow records, but the Flowmon team have taken that tried and tested technology and done some very cool things with it.
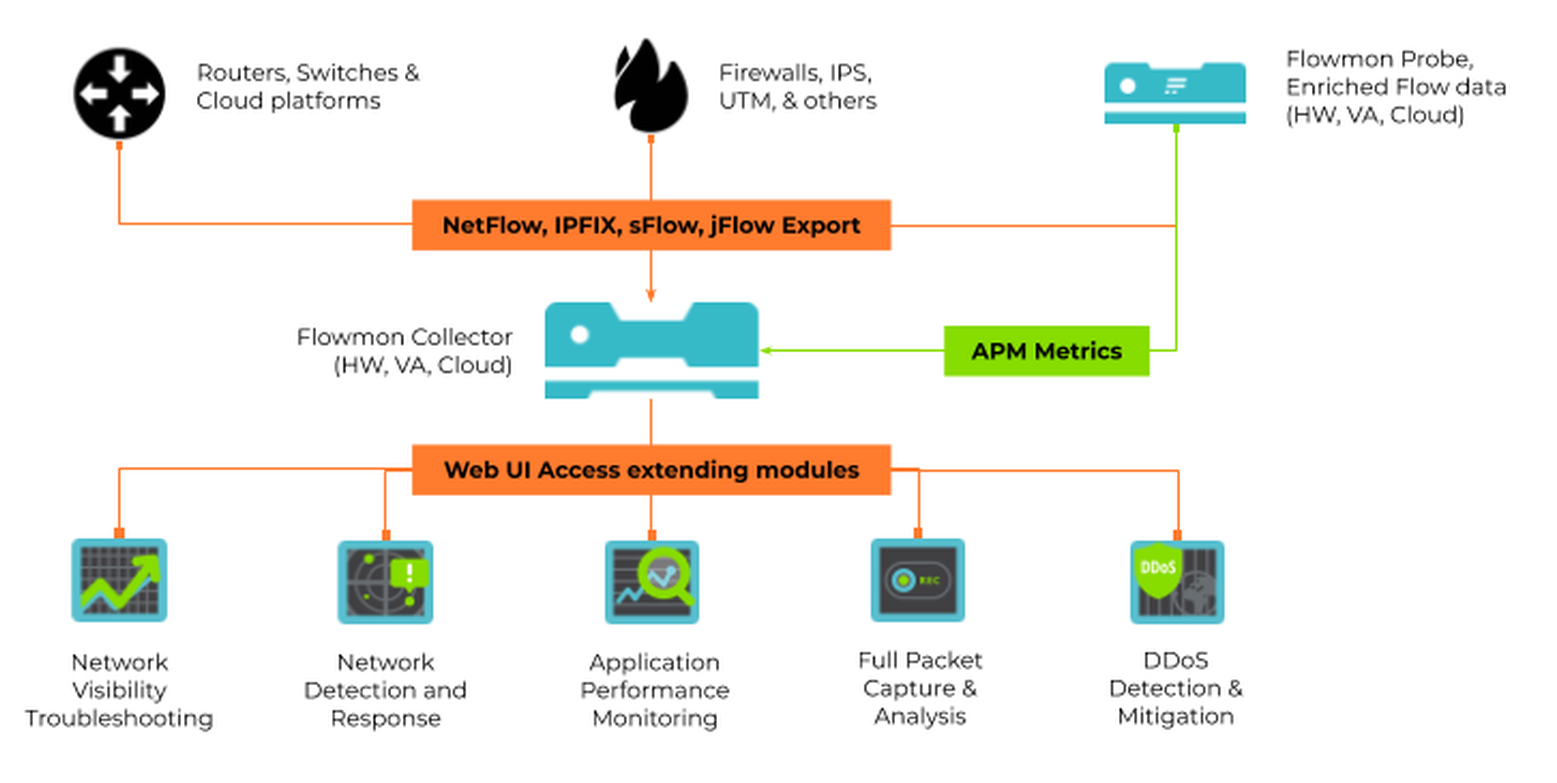
The Flowmon architecture is similar to that of PRTG. There are two main components -
Flowmon Collector acts like PRTG’s Core Server, and is responsible for processing and analysing data, producing reports and providing web-based GUI access. But it also collects the raw flow data for processing, in a similar way to PRTG’s Local Probe.
Flowmon Probe, converts the raw flow data into enriched network telemetry, extracting the detailed metrics contained in the flows which the other components of the system convert into actionable information. This data enrichment is what sets Flowmon apart from standard flow tools.
Both the Collector and Probe are available as physical or VM appliances, with various options for subscription or perpetual licensing that cover all deployment sizes from SME through to enterprise.
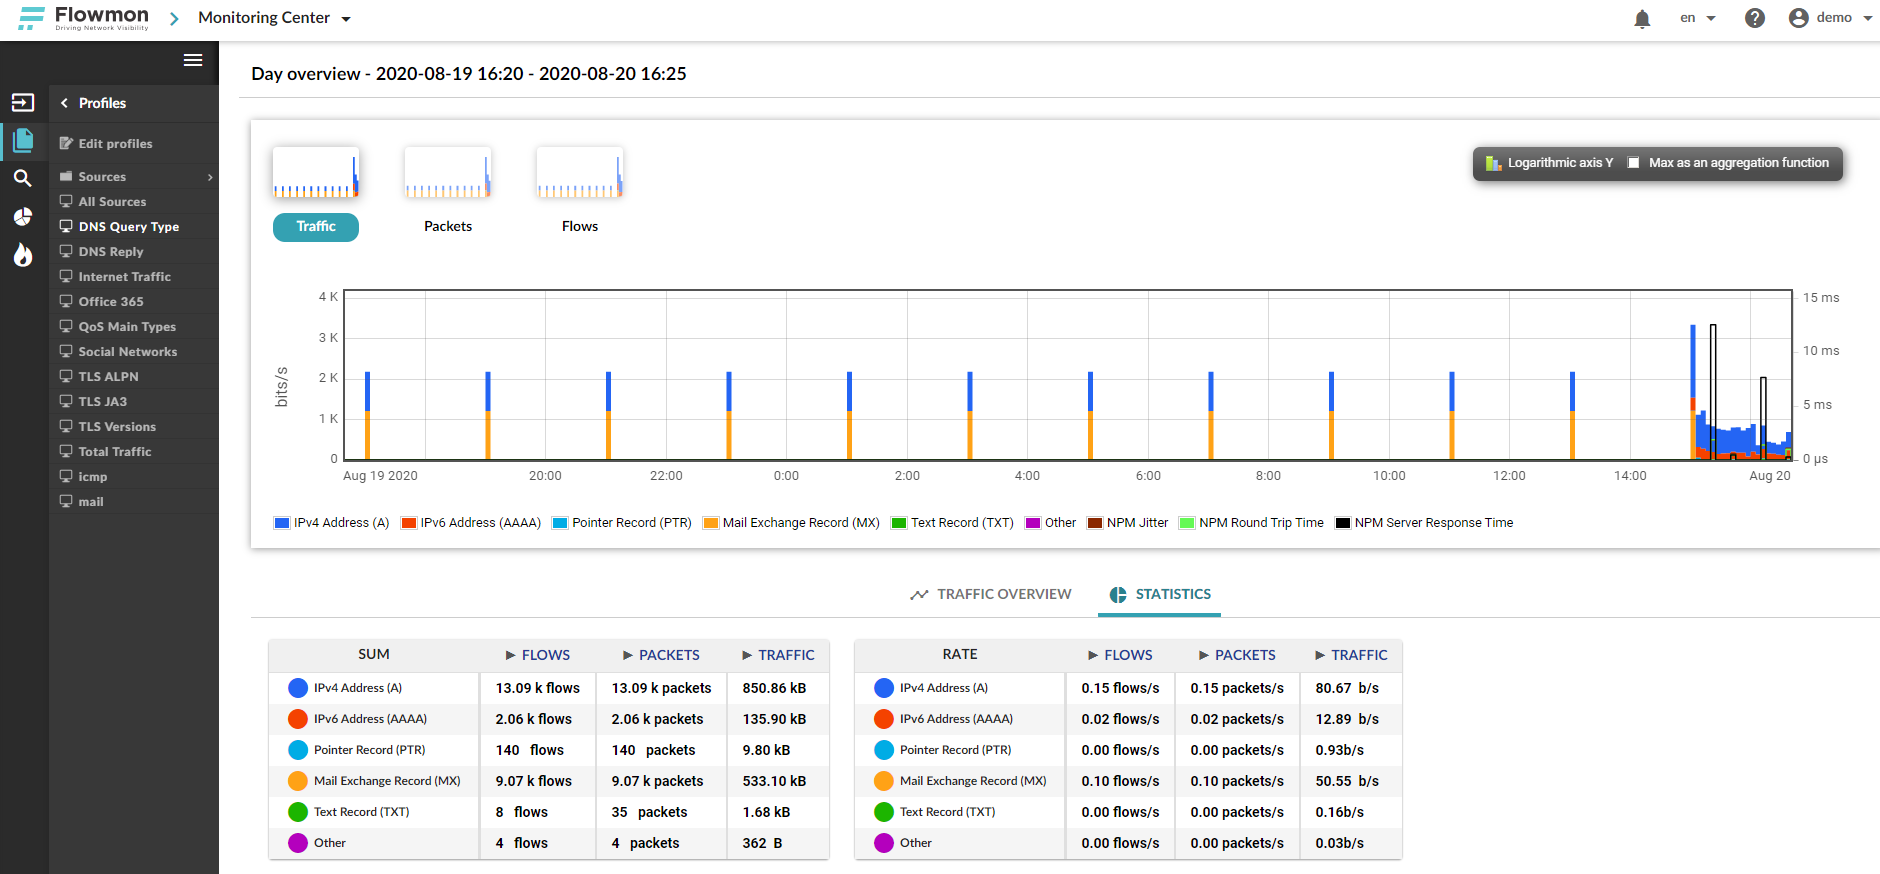
Flow Analysis
All the flow data collected by the system is collated and analysed through a centralised, web-based GUI known as the Monitoring Centre. It’s here you’ll find the more traditional xflow tools. The clear interface allows users to quickly create detailed analyses of the collected flow records – bandwidth utilisation, device-to-device conversations, protocol distributions and many other metrics can be added to dashboards. Sophisticated “profile” based filters can be used to focus the reports on specific devices, ports or protocols, including industrial protocols such as GOOSE and IEC 104. Monitoring Centre also allows alerts to created based on numerous conditions and thresholds. These can be chained together and combined with filter profiles to create sophisticated alarm-action relationships that can trigger various notification or remediation events.
In addition to Monitoring Centre, additional software modules can be added to the system to fulfil specific tasks -
- Anomaly Detection
- Application Performance Monitoring
- Packet Investigator
- DDoS Defender
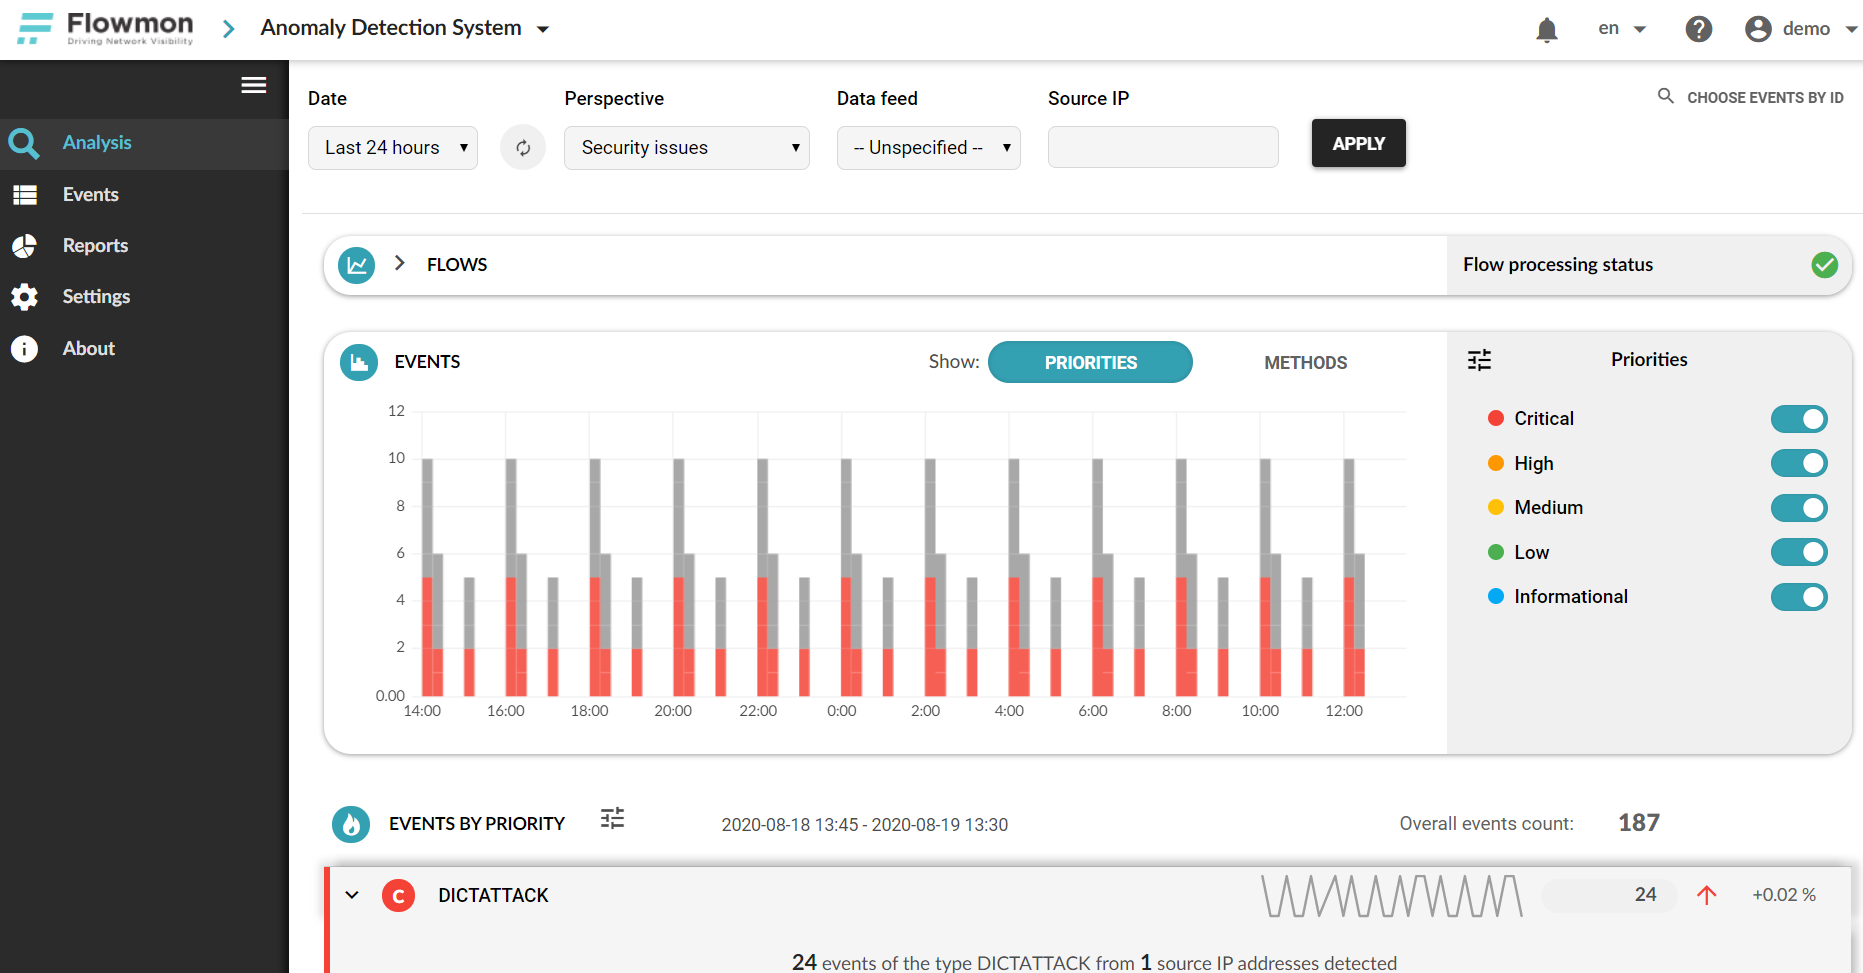
Anomaly Detection
Traditional signature & rule-based tools such as firewalls, IDS/IPS and anti-virus systems can be very effective in identifying and defeating compromises based on known malicious code or behaviours. But they mostly focus on securing the network perimeter and endpoints. But of course, not all threat vectors follow a North-South path. Research continues to highlight the risks of East-West, or “insider threats”, those that cannot be detected by network edge focused security tools.
Flowmon’s Anomaly Detection module combines signature-based detection methods with machine learning capabilities, adaptive baselining and advanced heuristics to analyse network traffic and identify potentially malicious activity, including common compromise indicators such as network surveillance activity, lateral movement attempts, exfiltration of data and connections to command & control networks.
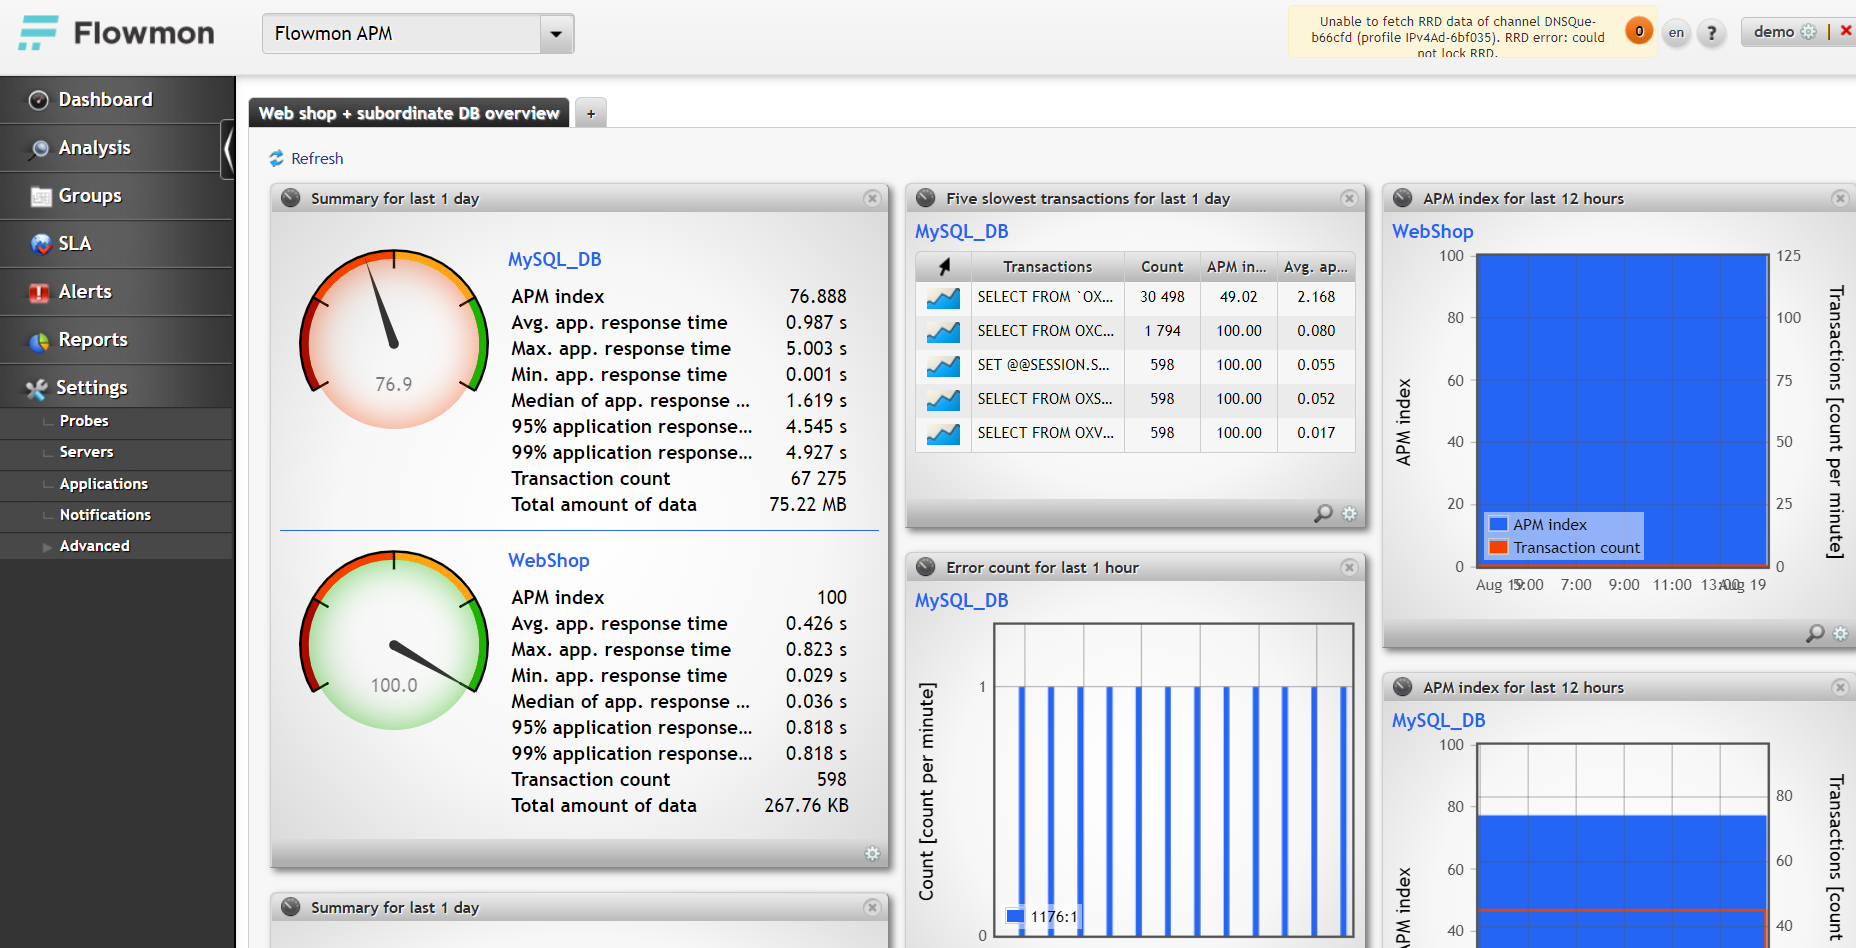
Application Performance Monitoring
The IT department exists to provide services to their users. Poorly performing systems and applications can cause frustration and aggravation for customers and employees alike, with corresponding financial and reputational implications. APM systems are the tool of choice for checking on the health and performance of the applications that businesses rely on. Most APM systems require agents to be installed right across network to collect data from devices using the monitored applications. With Flowmon, that extra administrative burden is removed. Because Flowmon APM passively collects and analyses flow traffic from the network, it can provide administrators, DBAs and DevOps teams with a deep understanding of how their applications are performing without having to deploy, patch and manage hundreds or even thousands of agents.
Flowmon’s APM module can measure the two key metrics that determine application performance –
- Application Response Time (ART), which is the time difference between the last request packet (client – server) and the first response packet (server – client), taking place at layer 7 (application) of the OSI model.
- Transport Time (TT), the time difference between the first and last packet of a request or a response (depending on conversation direction).
The analysis is further enhanced by capturing full details of SQL queries, URLs, server status codes and more, to provide a great insight on what actually happens as a user interacts with an application.
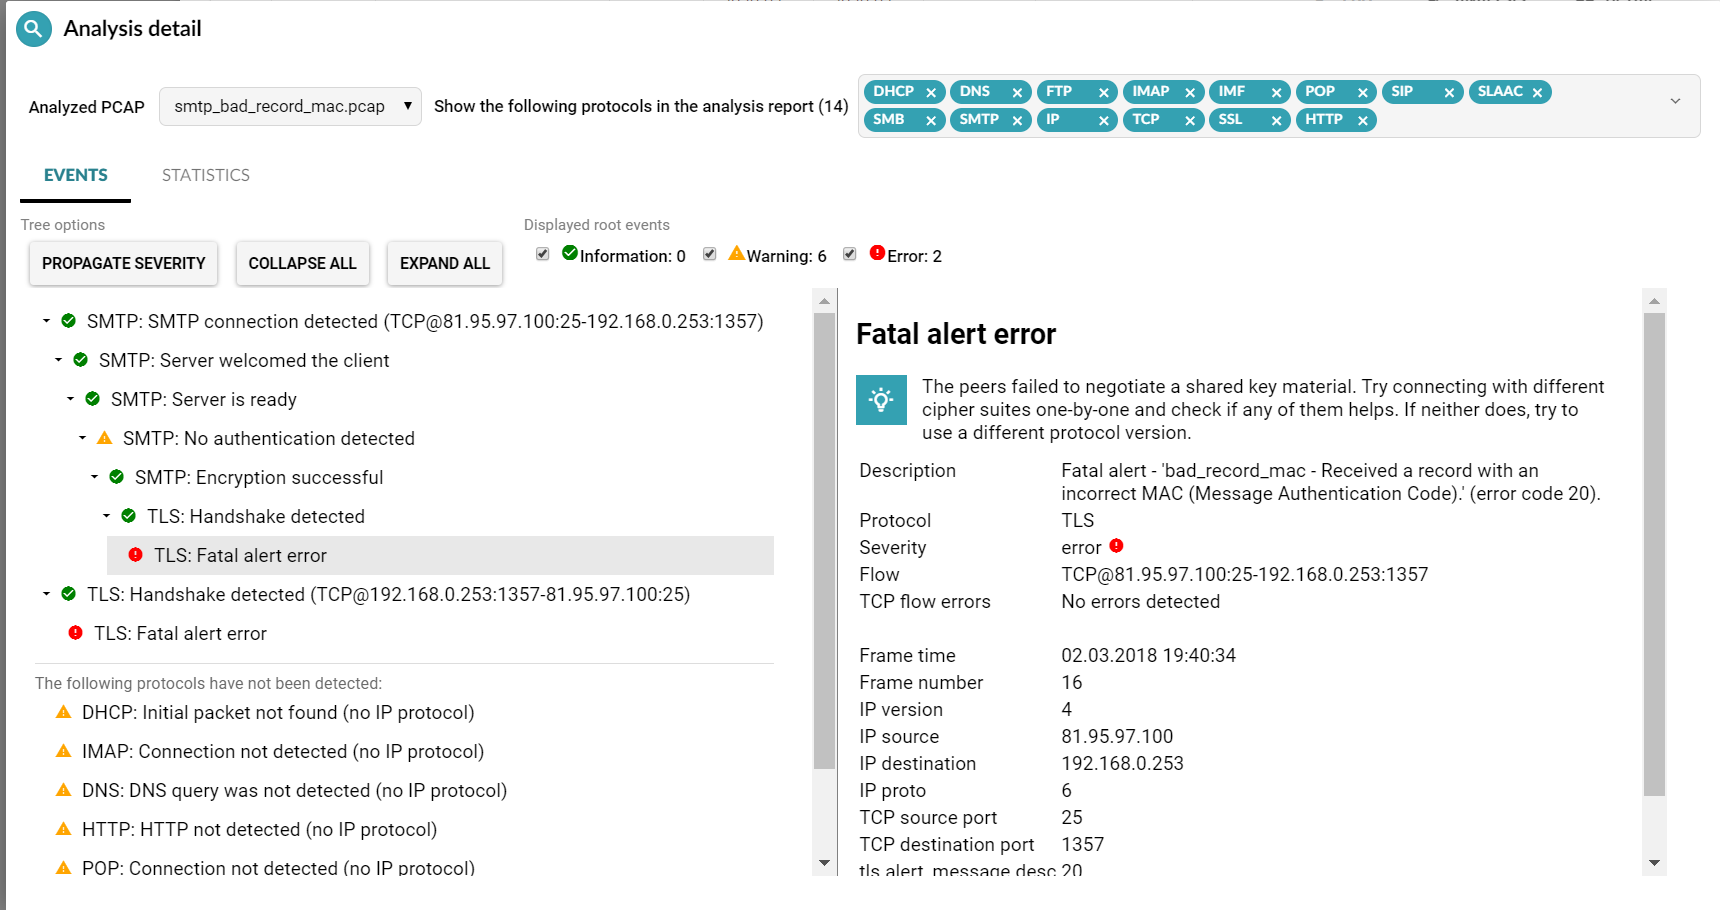
Packet Investigator
One of the most frequently used utilities in the NOC / SOC analyst’s toolkit is a packet analyser - capable of pulling packets from the network, dissecting them and interpreting them to visualise what is happening on the network. Probably the most commonly used tool in this field is Wireshark, which has been around in various forms since the late ‘90s. While very powerful, Wireshark is a standalone tool, requiring manual configuration and expert knowledge to interpret the captured data.
Flowmon’s Packet Investigator does away with these problems. It’s an automated network traffic auditing tool that records and interprets full packet data from OSI layers 2 - 7. It provides automatic PCAP capture and a built-in expert “analytics engine” which can visualise the captured data and provide remediation suggestions to accelerate problem resolution and reduce downtime.
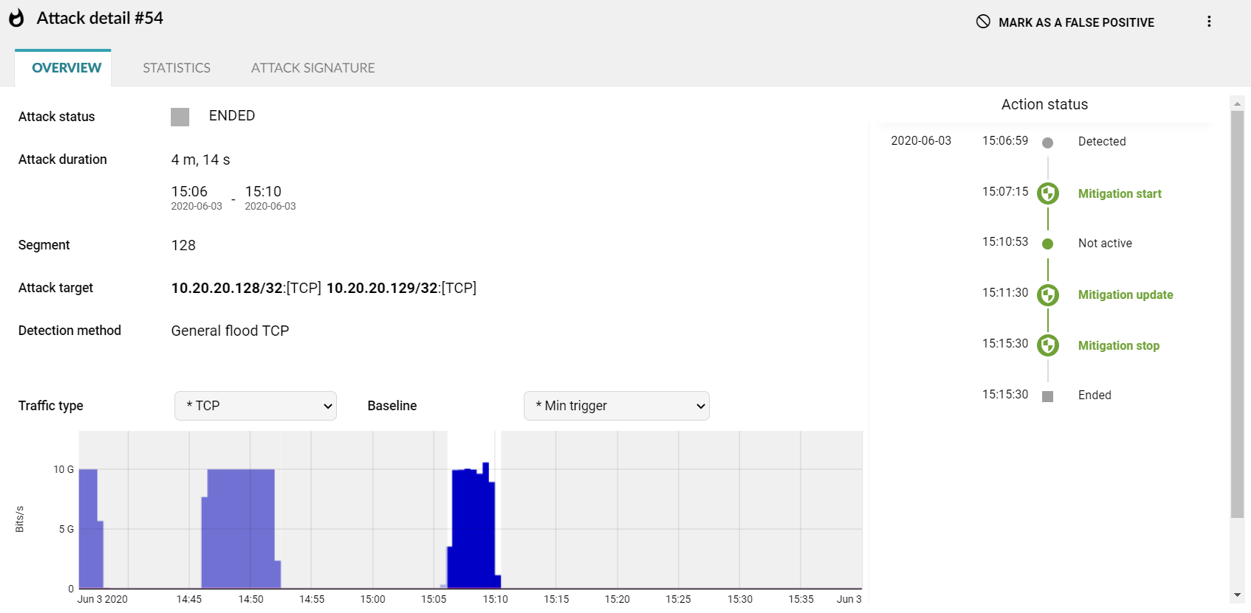
DDoS Defender
Massively disruptive but unfortunately easy to orchestrate, from the darker corners of the web, Distributed Denial of Service Attacks are a big problem for all network administrators, and especially ISPs. The most common DDoS method is the “volumetric attack” where an internet facing device is maliciously swamped with more traffic than it can process, thus inhibiting its ability to process genuine traffic. This leads to slow responses or even worse complete loss of the effected service. Once these volumetric attacks have reached their target, they are extremely difficult to counter, so the key is to detect the start of an attack as early as possible and take appropriate action.
Flowmon DDoS Defender automates the identification and response to DDoS attacks. The near real time nature of flow analysis allows the system to identify any abnormal increase in traffic in seconds. It can then trigger a variety of remedial actions, depending on the network design and features. This can include diverting traffic through policy-based routing, injecting blocking rules into next-gen firewalls via script or integrating with third party out-of-path mitigation systems.
Dashboards & Reports
Finally, the Dashboard and Reports module allows administrators to create detailed, widget-based dashboards that illustrate the status of the monitored network. The interface is tab based so different views of the data can be provided to different teams.
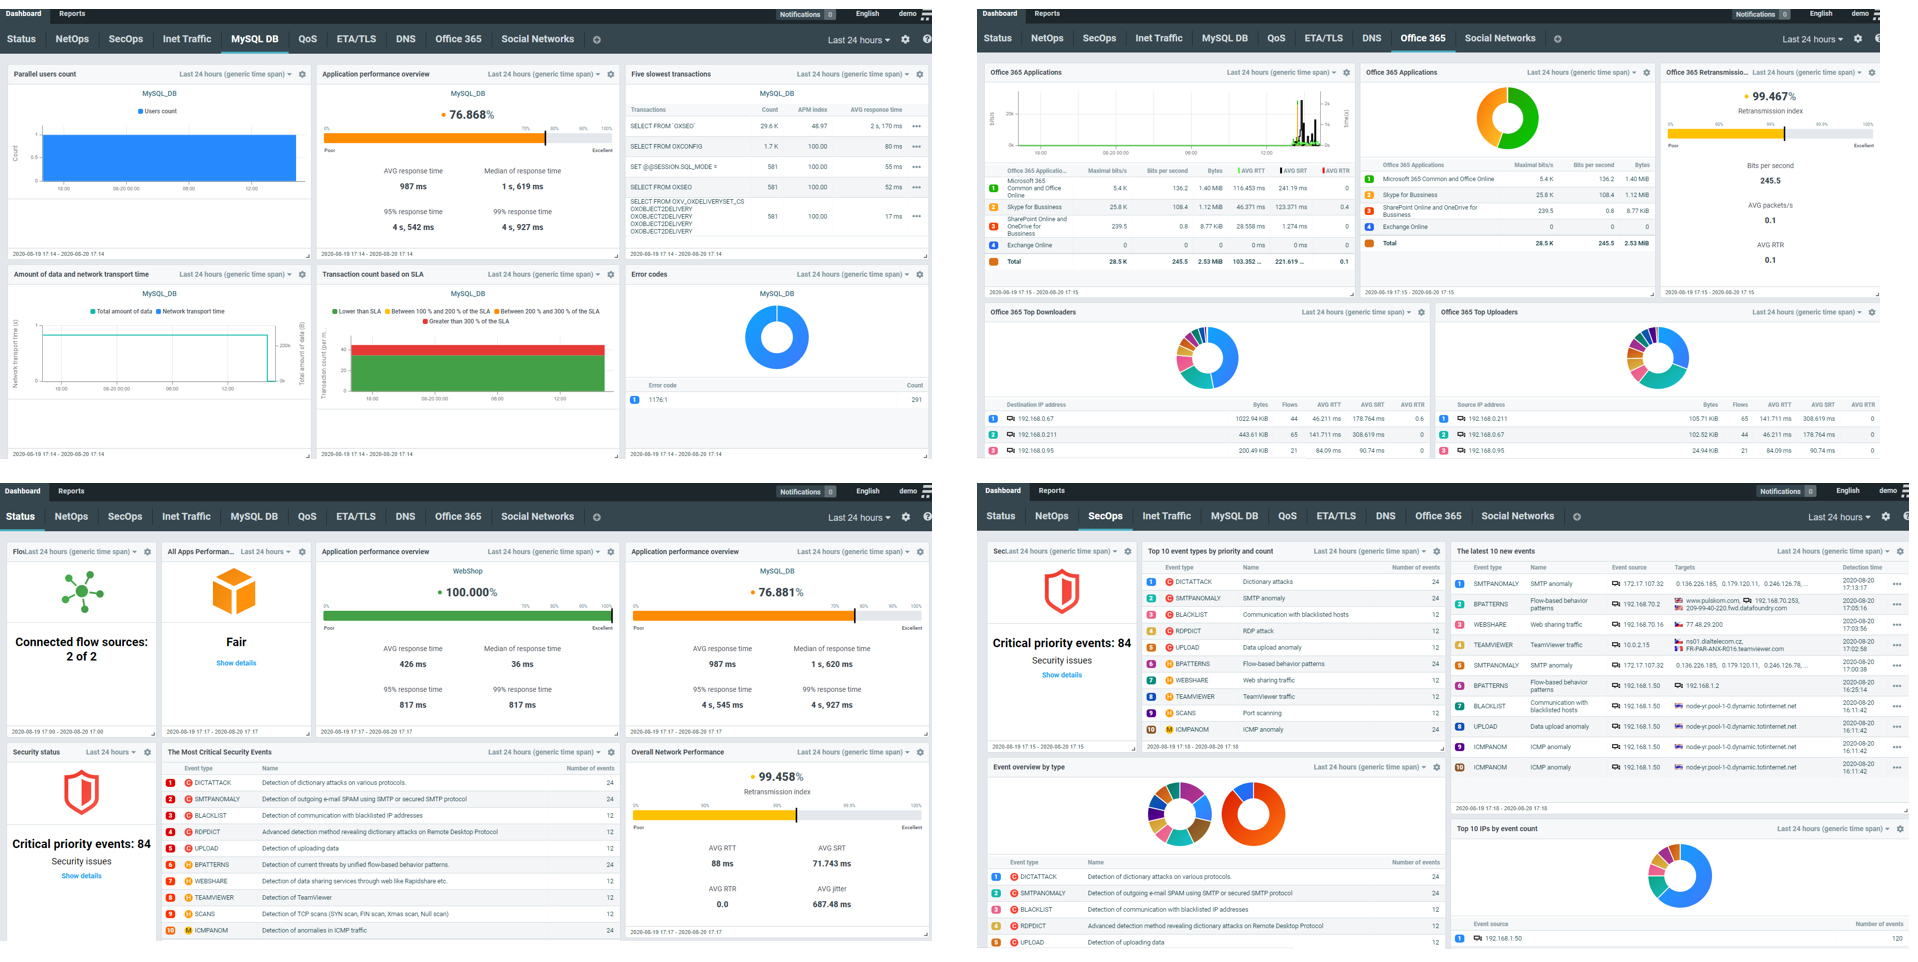
The collected data can also be “sliced & diced” using the built-in reporting system. This allows both ad-hoc and scheduled reports to be created, combining data from user defined “chapters” which act as templates to quickly design new report layouts.
So Where Does PRTG Fit In?
I’m glad you asked. As we’ve seen, Flowmon provides superb deep-dive network traffic analytics, application performance and anomaly detection. Combining those capabilities with PRTG’s unrivalled ability for monitoring almost anything with an IP address; gives Sysadmins, NoC / SoC analysts and DevOps teams the best possible toolset for guaranteeing the performance of the network while maximising its security.
There are three ways that Flowmon and PRTG can work together. Flowmon have developed a set of Python based scripts, available through their Customer Portal, that retrieve data from the ADS and Monitoring Centre modules. Combined with PRTG Python Script Advanced Sensors, the collected data can be added to PRTG maps (dashboards) in the usual way. More information about the Python scripts can be found here - How can I integrate Flowmon into PRTG Network Monitor?
Next, as the Flowmon platform includes a REST based API (documentation available from the Flowmon Portal), you can use PRTG’s REST Custom Sensor to retrieve a huge variety of health, performance and analytics data from your Flowmon environment.
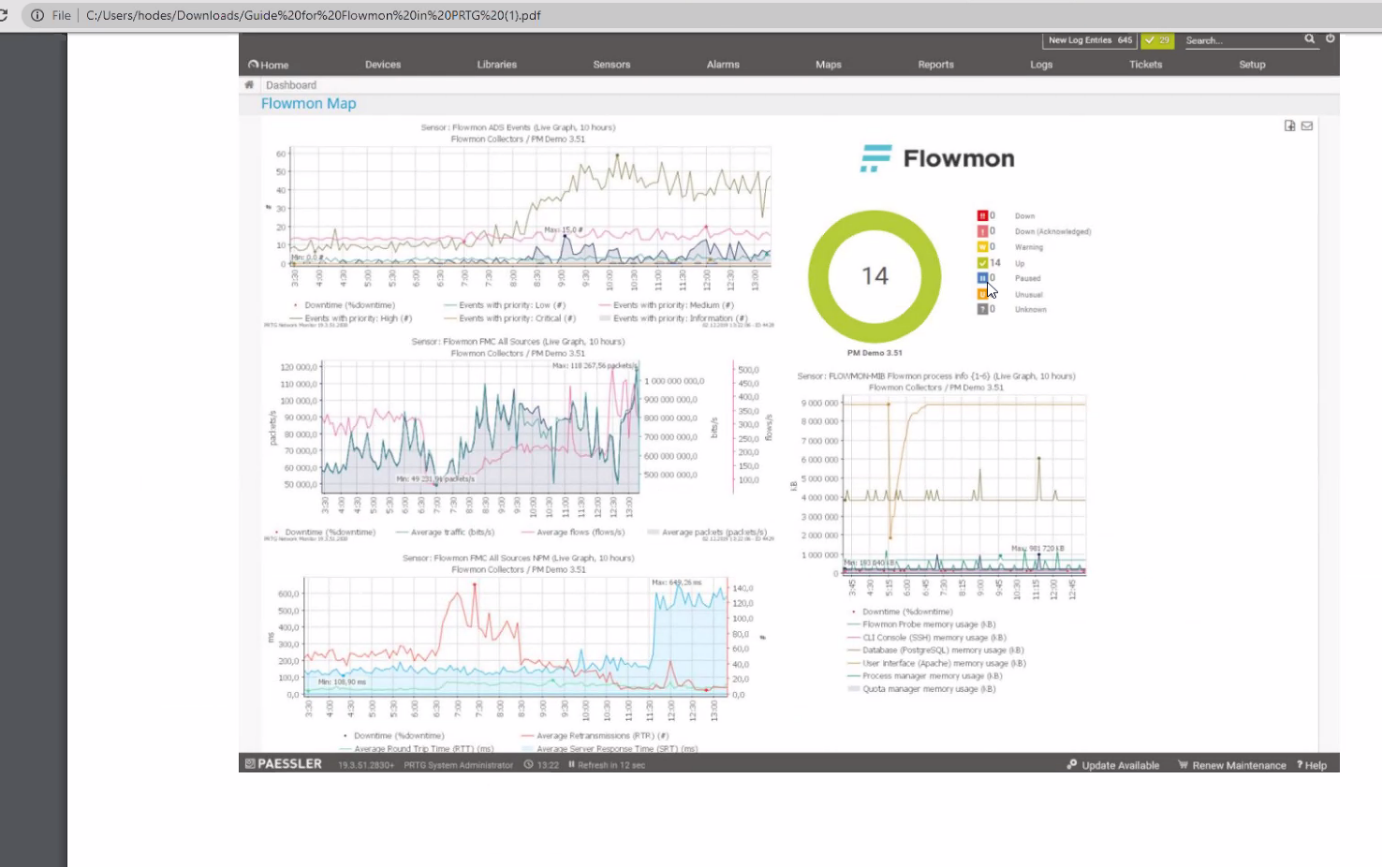
Finally, as also described in the How can I integrate Flowmon into PRTG Network Monitor? Page, Flowman provide SNMP MIB files for their appliances, which can be used with standard PTRG SNMP sensors to monitor the health and performance of your Flowmon devices.
Summary
PRTG is a fantastic tool for keeping administrators informed about the overall health and performance of their systems, be they in traditional IT networks, sprawling IoT deployments or even medical or industrial environments. But, if there is a need to look deeper into the traffic traversing those networks to see how applications are performing, or to detect and mitigate security threats, then the Flowmon suite provides a powerful, tightly integrated set of tools to give administrators that additional insight.
SOURCE: https://blog.paessler.com/perfect-monitoring-combine-prtgs-breadth-with-flowmons-depth


