Traditional IT management practices are no fit for today's modern day businesses that are powered by cloud and datacenters. Now, IT is more dynamic and provisioned quickly with technologies such as virtualization and elastic computing. That says, IT is not confined within the office and extends to all across the globe. With more and more applications being served over the cloud from all around the world, it is imperative for you to ensure seamless access to mission critical applications and provide a good end-user experience.
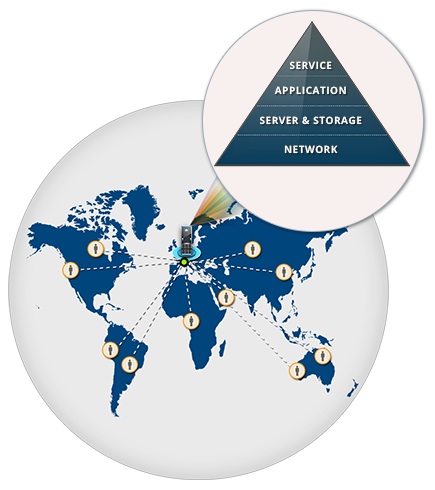
Provide an uninterrupted access to mission critical applications and the best user-experience networks and applications should no longer be managed as discrete entities. The problem with such a model is that all the performance data and events remain separate, and needs lot of manual effort to correlate them to get a clear picture. By the time you trace the fault and fix it, users would have started to receive a 404 error.
Causes for slowness or loss of access to an application
- Recent configuration change done at the core router
- Server system resource scarcity
- Switch port may be down
- Bandwidth bottlenecks
- Problem with the ISP's WAN links
- Application itself might have crashed
Correlation of App & Network performance data is the key to identify where the fault is
delivering an application seamlessly lies in identifying where the fault is. The sooner you identify the fault, the faster you can fix it. Disparate tools help you know the performance of network and applications in silos. There would be no correlation between them. It requires a lot of manual effort to analyze various reports and come to an assumption where the fault would be.
Monitoring Applications from a network perspective (a.k.a Application-aware Network Performance Management) provides the correlation between application and network performance data. It provides in-depth visibility into the impact caused by the applications on your network and vice versa, and helps you identify where the fault is exactly.
OpManager provides the required correlation between App & Network performance data
OpManager now includes in-depth application monitoring capabilities into its existing portfolio. This helps you also monitor your mission critical applications such as Oracle, SAP, Sharepoint, Webshpere, etc. along with your network and servers from a single console.
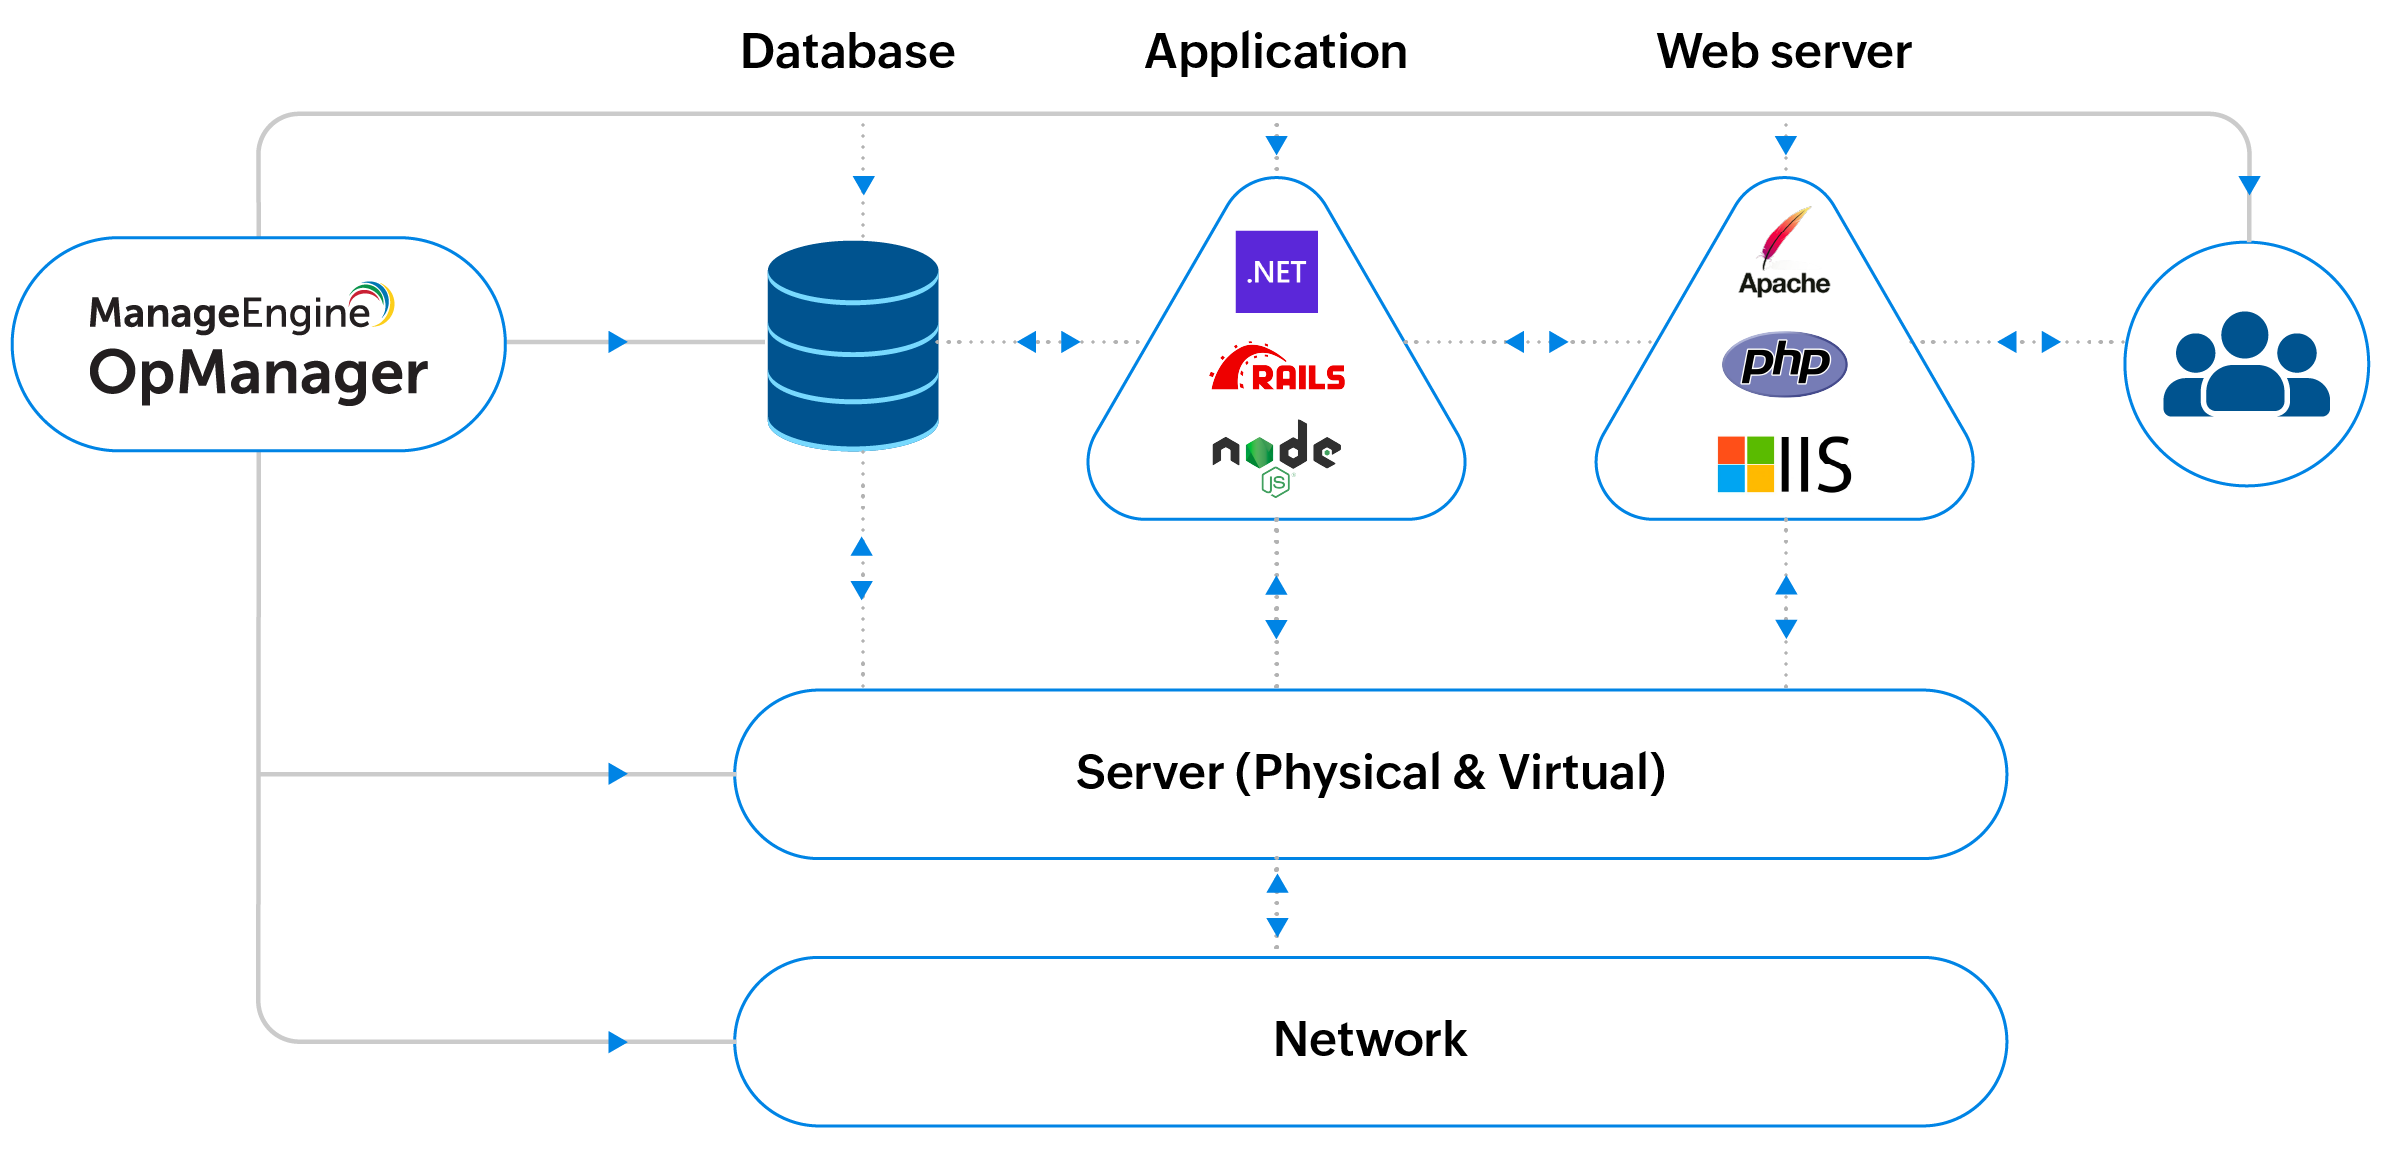
Being a comprehensive network management software, OpManager, with the newly added application monitoring functions, provides application-aware network performance management. In case of any application slowness or loss of access to an application, OpManager provides the required visibility into Network, Server and Application levels. It allows you drill down from the end-user experience level to the network level to find out where the fault is in a quick and easy way.
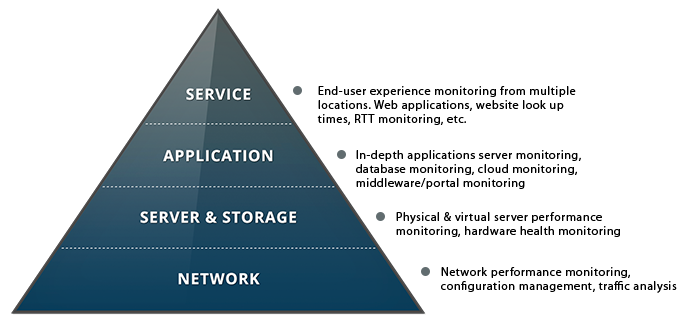
What does OpManager now provide with the newly added Application Monitoring plugin?
In-depth Application Monitoring
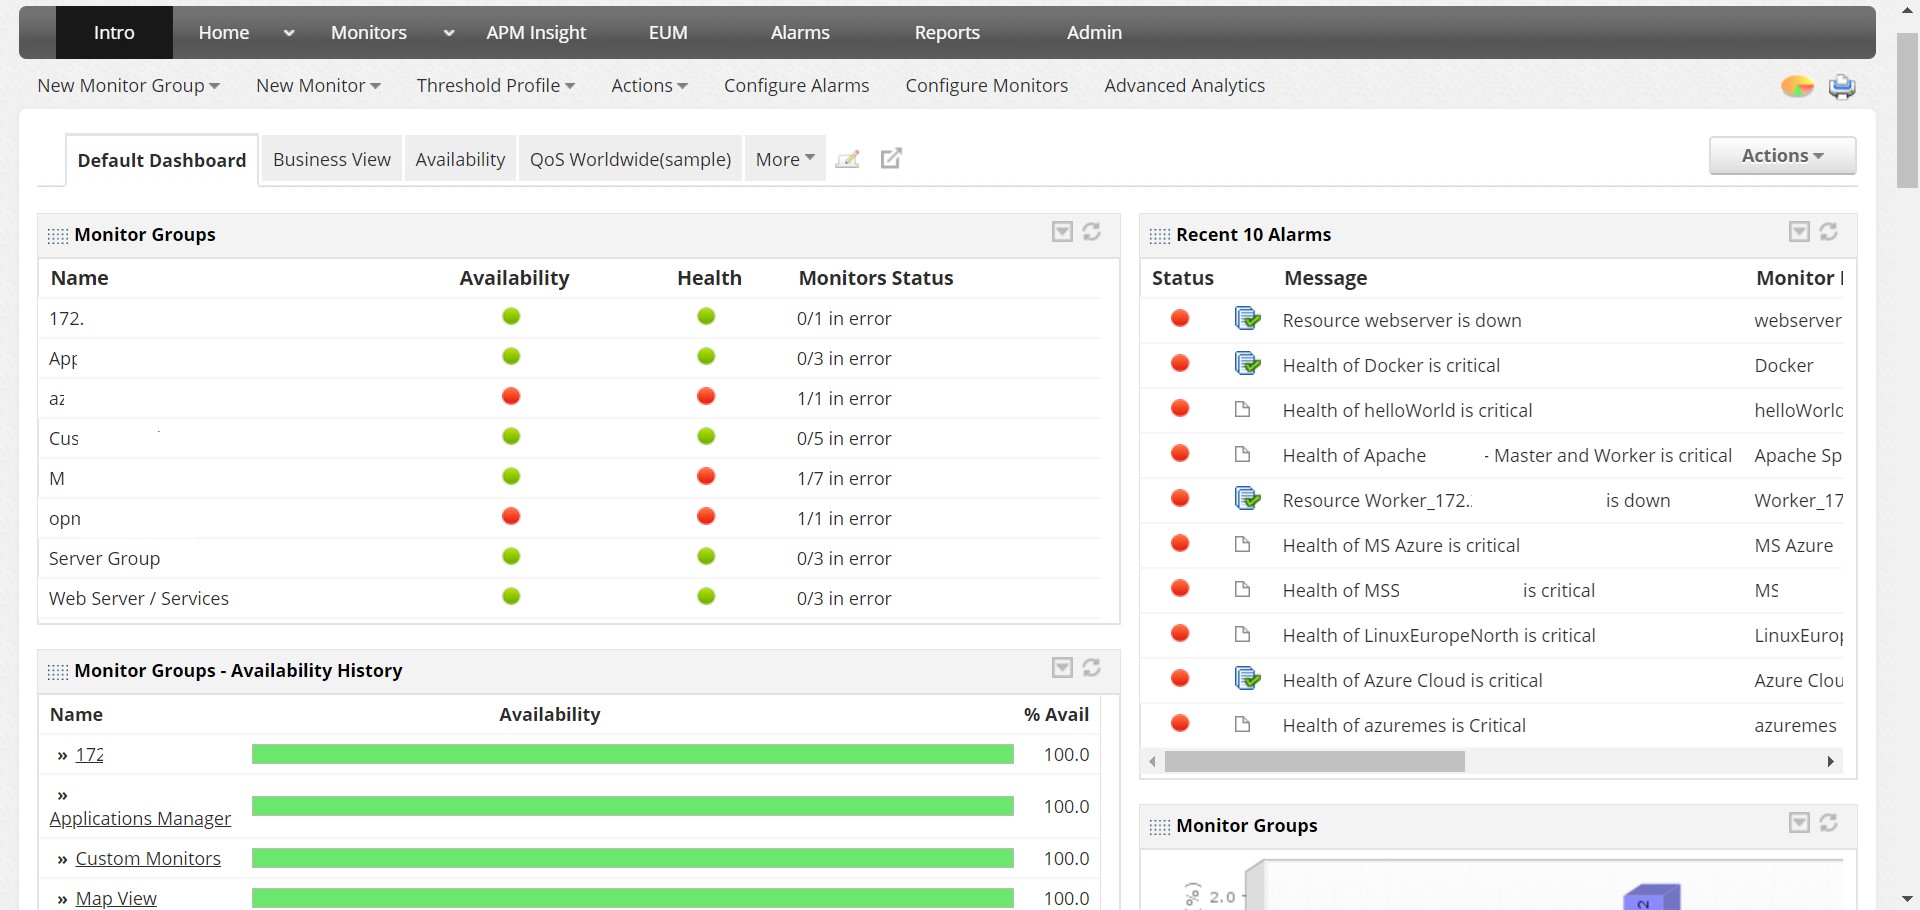
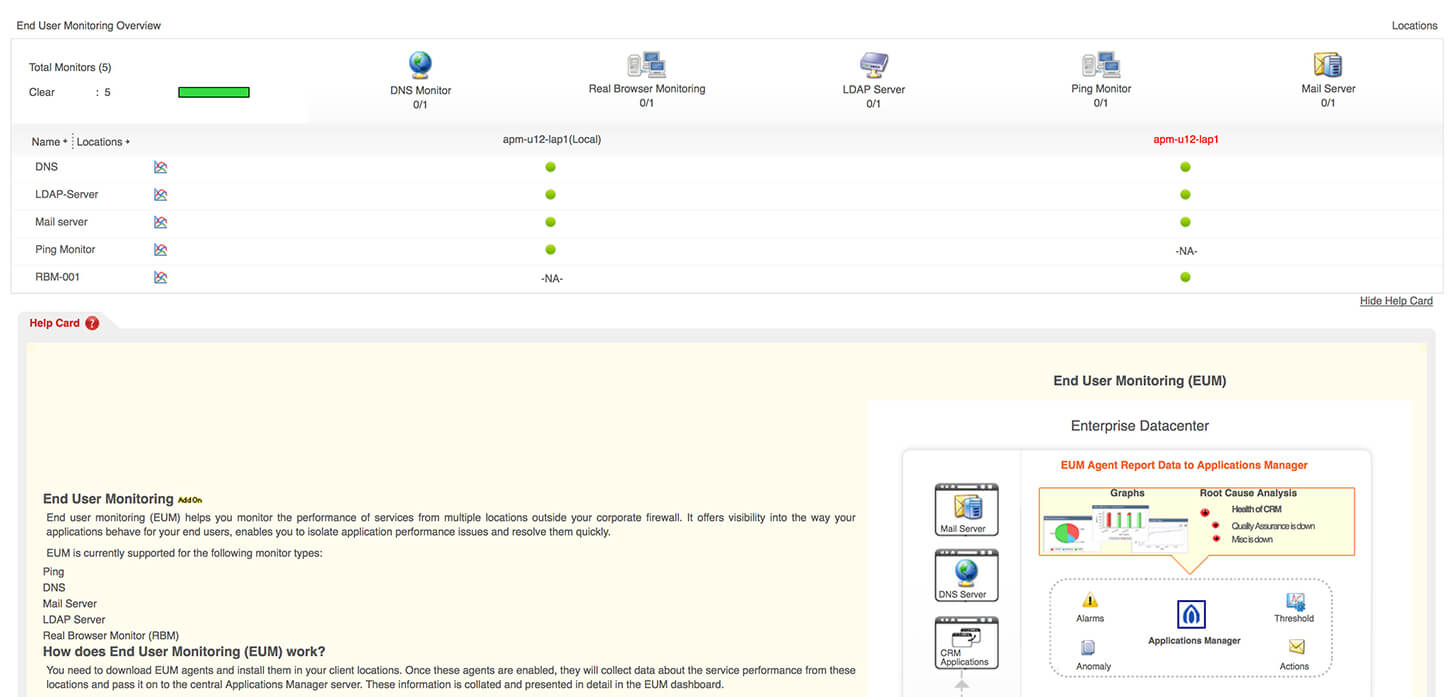
Real-time End-user Experience Monitoring
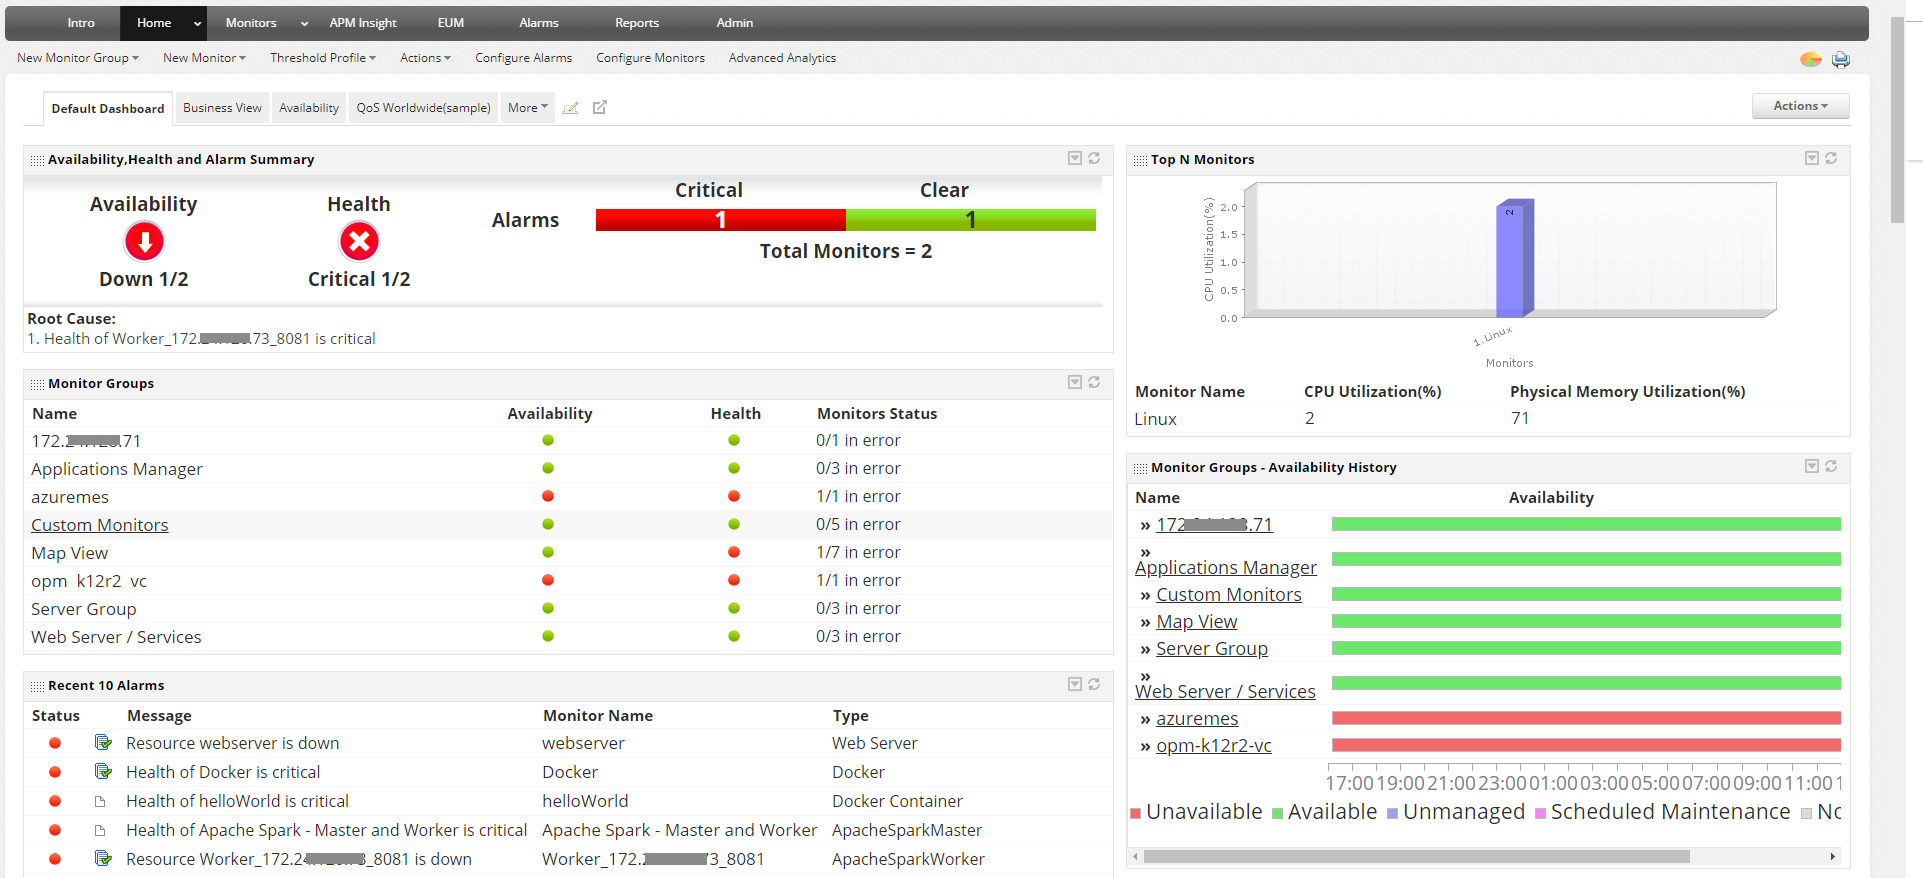
Single Dashboard for viewing the Performance health of Network & Application in real-time
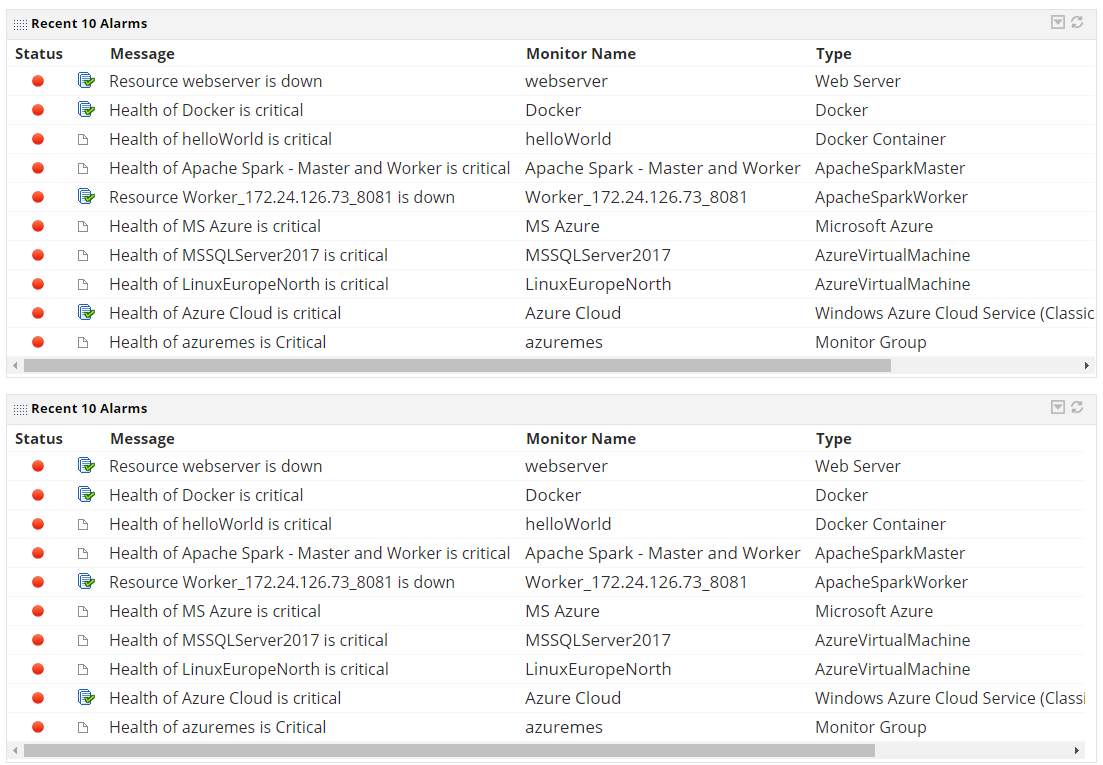
Singe alarm console for Network, Server & Application faults
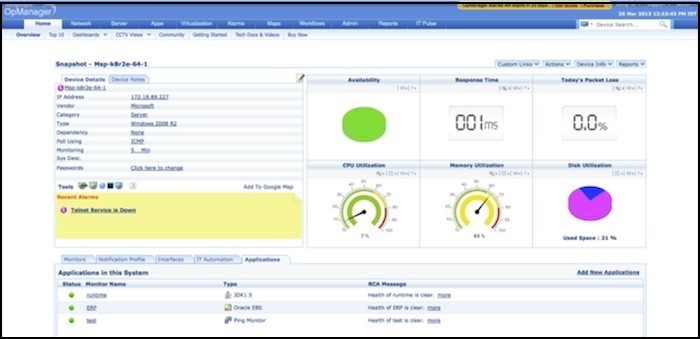
Device snapshot page with System and Application Performance Data.
About OpManager
ManageEngine OpManager is a network management platform that helps large enterprises, service providers and SMEs manage their data centers and IT infrastructure efficiently and cost effectively. Automated workflows, intelligent alerting engines, configurable discovery rules, and extendable templates enable IT teams to quickly setup a 24x7 monitoring system within hours of installation. Do-it-yourself plug-ins extend the scope of management to include network change and configuration management and IP address management as well as monitoring of networks, applications, databases, virtualization and NetFlow-based bandwidth. For more information on ManageEngine OpManager, please visithttps://www.manageengine.com/network-monitoring/.
To download a free 30-day trial, visit: https://www.manageengine.com/network-monitoring/download.html


