
Ubiquiti Networks offers a range of wireless hardware and software for enterprise WiFi and operator WiMAX wireless data communication. In this article, we’ll explain how to monitor Ubiquiti’s UniFi WiFi systems using PRTG.
One way to monitor each of your UniFi access points is with PRTG’s standard SNMP sensors together with Ubiquiti’s private MIB files. This lets you monitor each access point in depth, giving you insight into any data available in the MIB file.
iSNMP stands for Simple Network Monitoring Protocol. Its usefulness in network administration comes from the fact that it allows information to be collected about network-connected devices in a standardized way across a large variety of hardware and software types. SNMP is a protocol for management information transfer in networks, for use in LANs especially, depending on the chosen version. Read more ...
However, monitoring single access points via SNMP has a few disadvantages:
- The UniFi series only supports SNMP v1 (see screenshot below)
- You will need SNMP access to each access point, which could be an issue if the access points are spread across multiple locations
- You can only view details about one access point at a time, and can only display metrics that one access point knows. Global metrics for the entire installation aren’t available from a single access point because one AP simply doesn’t have a global overview.
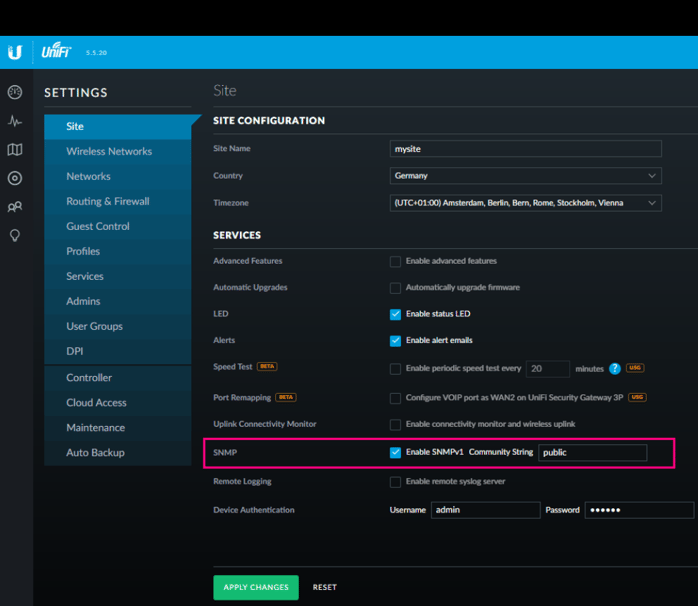
Ubiquiti UniFi SNMP Settings
So, to improve visibility into your UniFi environment, we’ve created a new custom script sensor to monitor the controller directly, giving you an overview of all of your access points in a single sensor.
A huge thanks to Luciano Lingnau from our technical support team, who published the following script in our Knowledge Base.
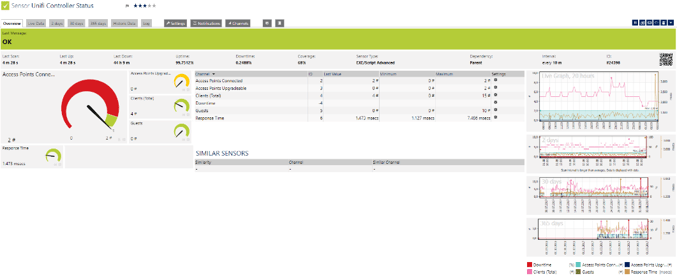
This script uses the UniFi RESTful API to pull data into PRTG, where it will then display controller metrics such as:
- Response time from the controller’s API
- The number of access points connected to the controller (UAPs in “connected” status)
- The total number of connected clients, including guests
- The total number of connected guests
- The number of upgradeable access points (UAPs in “connected” status, with the “upgradeable” flag set)
Since this script collects all data directly from the UniFi controller, you’ll see a global overview about all access points that are connected to that controller. And you only need HTTP access to the controller – you don’t need SNMP access to each individual access point. To run Luciano’s script, check out his article, which includes the requirements, detailed instructions, and (of course) the code for the script.
In addition, Frank Carius, a German blogger, has extended this script to include:
- Amount of data
- Clients/ virtual network
- RX and TX bytes, dropped and errors
- ….
Frank’s blog article is only available in German, BUT even if you can’t read the article, you can download the script (which is commented in English!) here.
The extended script in action
To run the extended script you’ll need to download the file and save it to
Then, before you run the script, you need to set a few parameters, either inside the PRTG custom script sensor settings, or directly inside the script:
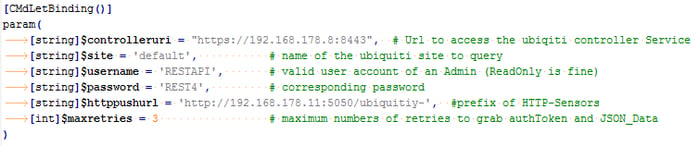
You’ll need to adjust all of the parameters to fit your environment. The “httppush.url”, for example, is set to “ubiquiti-” in the example script. This is used to create the GUID for the PRTG HTTP Push sensor later in the script:
The GUID consists of the beginning of the URL, the name of the SSID, and the frequency. If you run the script interactively with “-verbose”, you can easily find the URL:
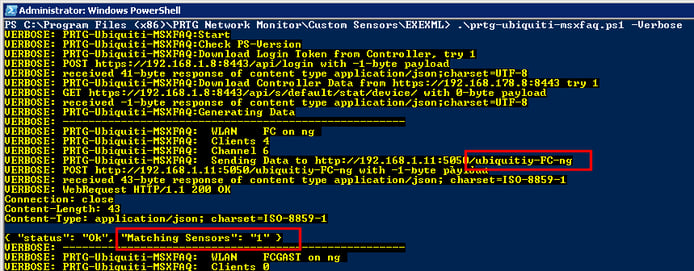
This script is capable of monitoring both the controller and all access points connected to that controller. Detailed per access point metrics will require one additional HTTP Push sensor per access point.. The HTTP Push sensors need to listen on port 5050 and must have GUIDs that match the string(s) shown above.
Once the sensors are up and running, and are receiving data from the script, you can use thresholds and notifications, just like with any other PRTG sensor.
And if you have other devices that aren’t covered by the pre-built PRTG sensors, be sure to check out our Script World site for lots more scripts!


