
Are you tracking your network’s KPI’s?
Deriving actionable business intelligence from the network is critical to improving network profitability and meeting SLAs. An important factor in managing & optimizing networks is to define, measure and quickly analyze the right Key Performance Indicators (KPIs). The KPIs are visual cues that indicate the network performance and help you make better informed decisions faster.
As a senior manager, you do not derive value from the overwhelming information about jitters, alarms and through-put. You need to focus on more wholistic & forward looking metrics that represent the complete network, a customer segment or a region depending on your business priorities. Needless to say, clearly defined KPI’s help you detect performance degradation and fix problems before it impacts customer SLA’s.
With WebNMS’ network management framework you can now build KPI Scorecards for your network in a single console. If you are already tracking KPI’s, you no longer need to manually collate and analyze large complex data sets in multiple spreadsheets or export data to commercial tools that would mash up the data for you. WebNMS allows you to quickly & easily define your network KPIs right there and track & analyze the network performance.
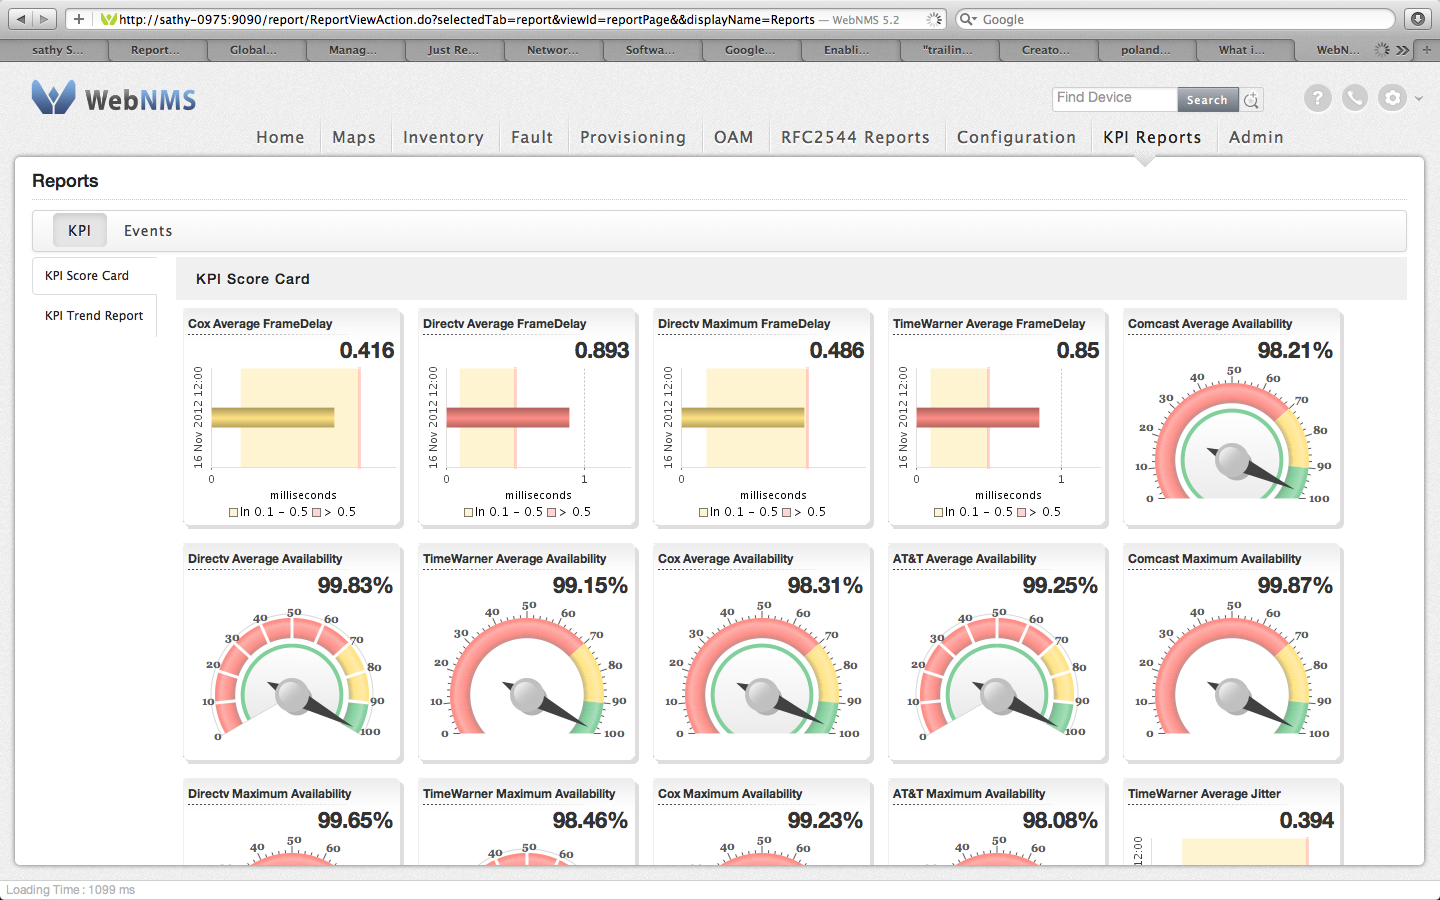
Sample KPI Scorecard
The KPI’s not only helps you see and understand data easily but enables you to align the performance with the set goals. The most important aspect is that the insightful metrics improve the speed & quality of the data-driven decisions multi-fold. Looking at the KPIs allows you to know how the network is performing and allows you to concentrate on your core responsibilities.
KPI’s are often complex metrics, derived from multiple individual metrics to provide more insightful & actionable value. Built over deep industry experience and insights, WebNMS offers generic network management KPI’s for the network managers and allows you to define your own business/domain specific KPIs.
For instance, you can now track if your average fault resolution time has improved, analyze the network utilization over a period or even detect the vendors whose devices are more faulty. If you want to track the network profitability or do a cost to utilization analysis, you could simply link up numbers from finance & accounting or sales servers. And all this is readily available for you to get a high level view in easy-to-read dashboards.


